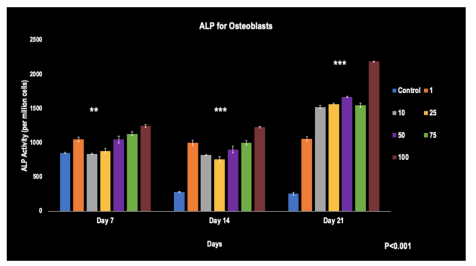
Figure 1: The ALP activity of Osteoblasts when affected by Simvastatin concentrations from days 7, 14, and 21 (N=6)
**, ***- represents the significant difference (p< 0.001) of the concentrations when compared to the control at all-time points. The error bars represent the standard deviations of six replicates.
Figures at a glance