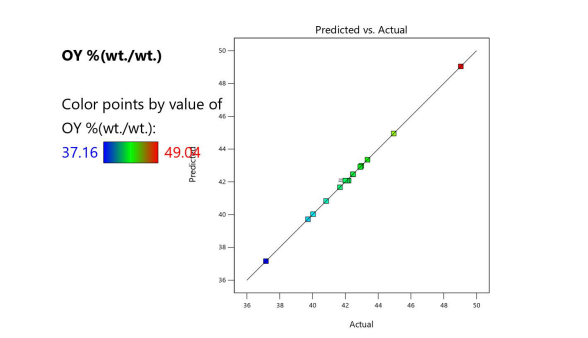
Figure 1: Predicted Vs. Experimental oil yield
|
|
|
Coded Factors Levels |
|
Variable |
Symbol |
-1 |
0 |
+1 |
TE (min) |
X1 |
40 |
50 |
60 |
VS (mi) |
X 2 |
200 |
250 |
300 |
WS (g) |
X 3 |
50 |
55 |
60 |
Table 1: Factors and their levels for Box-Behnken
TE = Time of extraction, VS=Volume of solvent, WS = Weight of sample
X1 (min) |
X2 (mL) |
X3 (g) |
OY %(wt./wt.) |
POY%(wt./wt.) |
Residual |
-1.000 |
-1.000 |
0.000 |
42.91 |
42.91 |
0.0025 |
0.000 |
1.000 |
1.000 |
44.95 |
44.95 |
-0.0013 |
1.000 |
1.000 |
0.000 |
40.83 |
40.83 |
-0.0013 |
0.000 |
-1.000 |
1.000 |
42.46 |
42.46 |
0.0012 |
0.000 |
1.000 |
-1.000 |
39.72 |
39.72 |
0.0012 |
0.000 |
0.000 |
0.000 |
42.00 |
42.08 |
-0.0800 |
0.000 |
0.000 |
0.000 |
42.10 |
42.08 |
0.0200 |
1.000 |
0.000 |
-1.000 |
42.10 |
42.08 |
0.0200 |
0.000 |
0.000 |
0.000 |
49.04 |
49.04 |
-0.0013 |
0.000 |
-1.000 |
-1.000 |
42.00 |
42.08 |
-0.0800 |
-1.000 |
0.000 |
1.000 |
37.16 |
37.16 |
-0.0025 |
-1.000 |
0.000 |
-1.000 |
42.47 |
42.47 |
0.0012 |
1.000 |
0.000 |
1.000 |
42.20 |
42.08 |
0.1200 |
1.000 |
-1.000 |
0.000 |
41.67 |
41.67 |
0.0012 |
0.000 |
0.000 |
0.000 |
40.03 |
40.03 |
0.0000 |
-1.000 |
1.000 |
0.000 |
42.98 |
42.98 |
-0.0012 |
0.000 |
0.000 |
0.000 |
43.35 |
43.35 |
0.0000 |
Table 2a: Experimental oil yield (%) and predicted values
POY = Predicted oil yield, OY = Oil yield
Source |
Sum of Square |
df |
Mean Value |
Prob>F |
F-value |
Model |
95.40 |
9 |
10.60 |
2647.50 |
< 0.0001 |
X 1 |
2.94 |
1 |
2.94 |
734.42 |
< 0.0001 |
X 2 |
8.41 |
1 |
8.41 |
2099.38 |
< 0.0001 |
X 3 |
41.09 |
1 |
41.09 |
10262.62 |
< 0.0001 |
X1X 2 |
0.0100 |
1 |
0.0100 |
2.50 |
0.1580 |
X1X 3 |
2.74 |
1 |
2.74 |
684.15 |
< 0.0001 |
X2X 3 |
4.16 |
1 |
4.16 |
1039.47 |
< 0.0001 |
X 12 |
22.74 |
1 |
22.74 |
5678.94 |
< 0.0001 |
X 22 |
10.03 |
1 |
10.03 |
2506.36 |
< 0.0001 |
X 32 |
5.15 |
1 |
5.15 |
1287.05 |
< 0.0001 |
Residual |
0.0280 |
7 |
0.0040 |
|
|
Lack of Fit |
0.0000 |
3 |
8.333E-06 |
0.0012 |
0.9999 |
Pure Error |
0.0280 |
4 |
0.0070 |
|
|
Cor Total |
95.42 |
16 |
|
|
|
Table 2b: Significance for every regression coe cient
Factor |
Coefficient of Estimate |
df |
Standard Erro |
95% CI Low |
95% CI High |
VIF |
Intercept |
42.08 |
1 |
0.0283 |
42.01 |
42.15 |
- |
X1 |
-0.6062 |
1 |
0.0224 |
-0.6591 |
-0.5534 |
1.0000 |
X2 |
1.02 |
1 |
0.0224 |
0.9721 |
1.08 |
1.0000 |
X3 |
-2.27 |
1 |
0.0224 |
-2.32 |
-2.21 |
1.0000 |
X |
-0.0500 |
1 |
0.0316 |
-0.1248 |
0.0248 |
1.0000 |
X |
-0.8275 |
1 |
0.0316 |
-0.9023 |
-0.7527 |
1.0000 |
X |
-1.02 |
1 |
0.0316 |
-1.09 |
-0.9452 |
1.0000 |
X1X2 |
-2.32 |
1 |
0.0308 |
-2.40 |
-2.25 |
1.01 |
X1X3 |
1.54 |
1 |
0.0308 |
1.47 |
1.62 |
1.01 |
X2X3 |
1.11 |
1 |
0.0308 |
1.03 |
1.18 |
1.01 |
Std. Dev |
|
|
0.0633 |
|
R-Squared |
0.9997 |
Mean |
|
|
42.23 |
|
Adj R-Squared |
0.9993 |
C.V. |
|
|
0.1498 |
|
Pred R-Squared |
0.9995 |
|
|
|
|
|
Adeq Precision |
244.7775 |
Table 2c: Analysis coefficients in Terms of Coded Factors
|
|
|
|
|
|
|
|
|
|
Table 3: Physicochemical Properties of Oil
Figure 1: Predicted Vs. Experimental oil yield
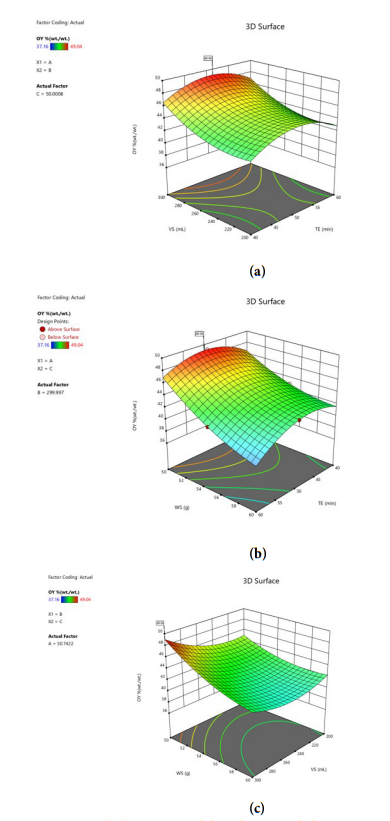
Figure 2: Contour and three dimensional plots
Tables at a glance
Figures at a glance