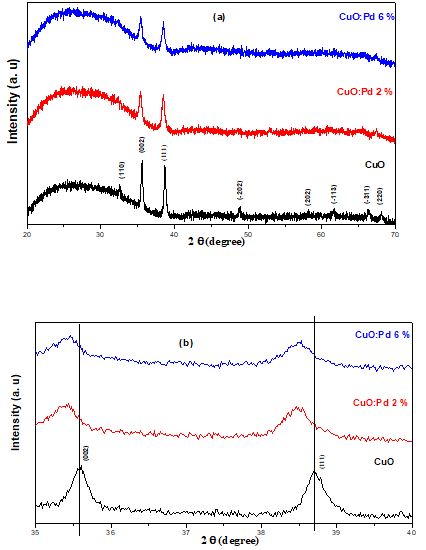
Figure 1: (a) (b) X-ray diffraction patterns for CuO, CuO: Pd 2%, and CuO: Pd 6% thin films
Figure 1: (a) (b) X-ray diffraction patterns for CuO, CuO: Pd 2%, and CuO: Pd 6% thin films
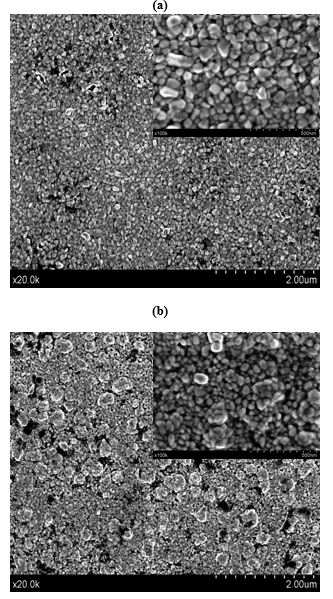
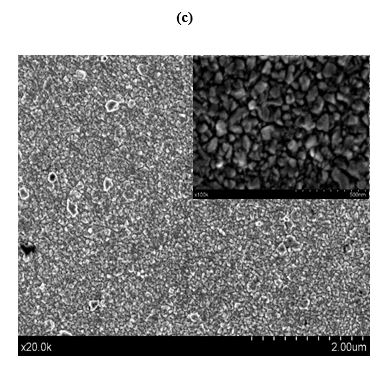
Figure 2: SEM images of CuO and Pd-doped CuO thin films as a function of Pd doping: (a) 0%, (b) 2% and (c) 6%
Figure 3: Response of the undoped CuO sensor to hydrogen at 180 °C operating temperature, for the hydrogen concentration range 15 000 – 1000 ppm.
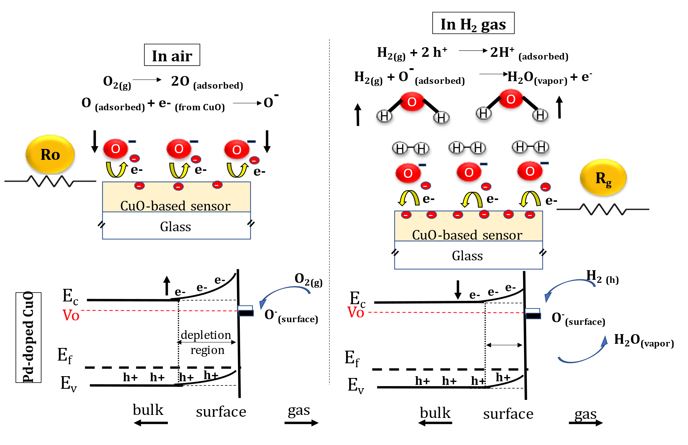
Figure 4: Illustration of hydrogen sensing mechanism of by CuO-based sensor and relevant energy band diagram
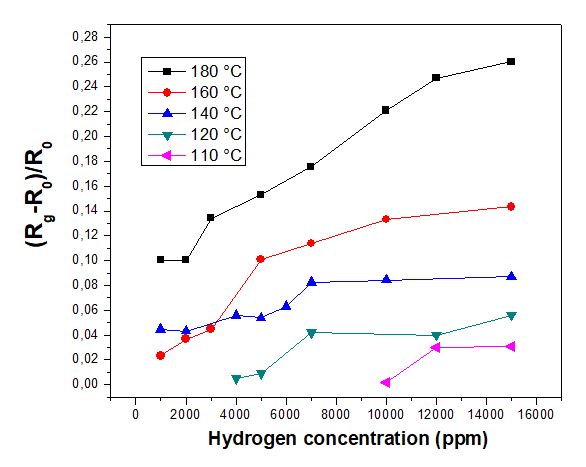
Figure 5: Sensor response of undoped CuO with respect to hydrogen concentration for various operating temperatures
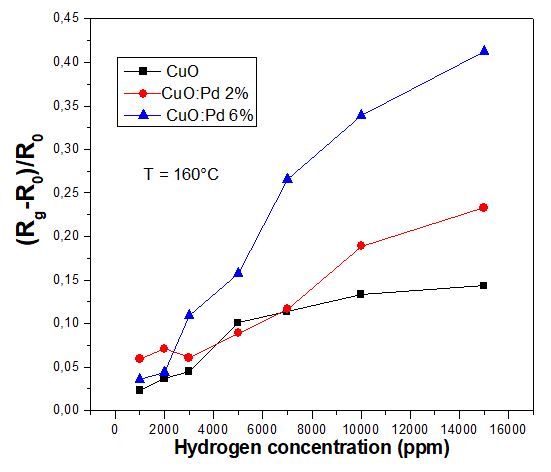
Figure 6: Maximum response of CuO, CuO: Pd 2% and CuO: Pd 6% sensors to different hydrogen concentrations for an operating temperature of 160 °C
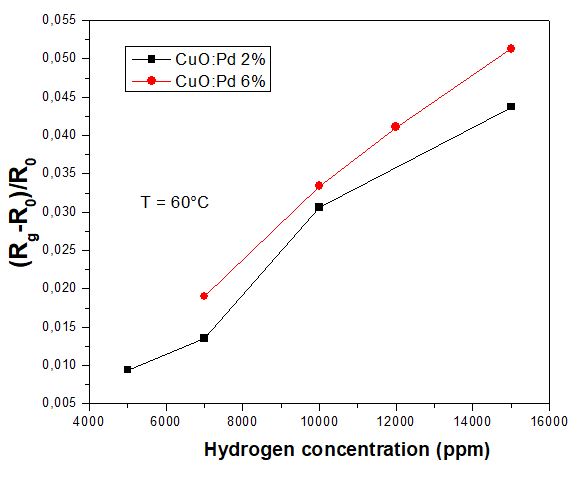
Figure 7: Comparison of the response of the sensors CuO: Pd 2% and CuO: Pd 6% to different hydrogen concentrations at 60°C
Tables at a glance
Figures at a glance