Effect of Gamma Irradiation Doses on the Spectroscopic, Optical Dispersion, and Structural Properties of Cr-39 Nuclear Track Detector
Received Date: May 08, 2025 Accepted Date: May 18, 2025 Published Date: May 21, 2025
doi:10.17303/jmsa.2025.9.103
Citation: IS Elashmawi, AM Abdelghany (2025) Effect of Gamma Irradiation Doses on the Spectroscopic, Optical Dispersion, and Structural Properties of Cr-39 Nuclear Track Detector. J Mater sci Appl 9: 1-12
Abstract
The effect of gamma-ray irradiation doses (4, 6, 8, and 10 Mrad) on the structural and optical properties of the Cr-39 solidsate nuclear track detector was studied before and after irradiation. The main characteristic amorphous X-ray peaks were observed with very slight changes in their intensity, confirming the structural stability of the Cr-39 solid-state nuclear track detector. The optical transmittance and absorbance of the irradiated sample were lower than those of the unirradiated sample in the UV region. The optical transmittance increased rapidly in the ultraviolet range (337-546 nm) until it reached an almost constant value in the visible range. Moreover, a red shift in cutoff wavelength (λcutof) was seen after irradiation, indicating that the fundamental absorption edge of the examined samples has decreased. Changes occurred in the optical band-gap values of all samples, with new groups of localized states generated near the valence and conduction band edges. The refractive index (n) values were observed to be increases after irradiation. The extinction coefficient increases with increasing wavelength as irradiated doses increase which was caused by surface plasmon absorption in irradiated samples.
KEYWORDS:
Cr-39 Polymer Detector; Gamma Irradiation; X-Ray Diffraction; FT-IR; UV-Visible Spectroscopy
Introduction
Increasing scientific and technological applications of the solid-state nuclear track, detectors have simulated efforts to develop better track-recording solids with varying relative radiosensitivity. Plastic nuclear track detectors are the best; they consist of long-chain molecules with different thresholds for detecting charged particles [1,2].
The Cr-39 polymer (Columbia resin #39) is a plastic detector type used in many scientific and industrial fields [2-5]. Radiation-induced ionizing and non-ionizing changes in Cr-39 polymer are of increasing research interest due to their potential scientific and technological applications [6-9]. Increasing scientific and technological uses of solid-state nuclear track detectors have stimulated efforts to develop more effective track-recording materials with variable relative radiation sensitivity [2,7,10]. Plastic nuclear route detectors are preferable because they consist of longchain polymers with varying thresholds for detecting charged particles.
The non-ionizing radiation is capable of causing thermal ionization if enough heat is deposited to raise temperatures to ionization energy levels. Bulk etch rates can be used to study the properties of plastic track detectors because they show how irradiation changes the structure of the plastic [1], [11-13]. But studies based on the change in optical density at certain wavelengths also show that the dose-response of the dosimeter has a small effect. It's hard to tell how much ionizing radiation someone has been exposed to. Plastic and Cr-39 are the most sensitive detectors because they have a discrimination threshold that is ten times lower than the others.
Polymers have become more important over the past few decades because they are light, cheap, flexible, corrosion-resistant, and easy to make in thick and thin samples. Cr-39 has become one of the most common polymers because of these qualities [14-16]. It can absorb visible, infrared, and nuclear radiation [17]. This makes it more useful for many things, like glasses, optical absorption, infrared absorption spectra, and viscosity. Since Cr-39 is a well-known plastic in the family of solid-state nuclear path detectors, it is also used to study how ionizing radiation affects a solid-state nuclear path detector [1,18-20]. It can keep better track of charged particles.
This work aims to study Cr-39 before and after exposure to 4, 6, 8, and 10 Mrad of gamma radiation. The samples are then analysed by ultraviolet-visible spectroscopy, infrared spectroscopy (FT-IR), and X-ray diffraction for Cr-39 before and after irradiation.
Experimental work
Materials
Small strips with dimensions 1 cm x 3 cm and 700 µm thickness of the Cr-39 plastic were obtained from American technical plastics Inc. The Cr-39 has the chemical formula C12H18O7 and a density of 1.32 g/cm3 . The material of the Cr-39 detector is transparent in the visible spectrum and almost opaque in the ultraviolet range. Gamma 1 (type J-3600, Canada, Ltd.) was used for atomic energy at the National Centre for Radiation Research and Technology (Cairo, Egypt). A 60Co gamma cell (2000Ci) was used as a gamma ray source with a dose rate of 1.5 Gy (150 rad/s). Each sample was subjected to a total dose of 4×10⁴ Gy (4 Mrad), 4×10⁴ Gy (4 Mrad), 8×10⁴ Gy (8 Mrad), and 10×104 Gy (10 Mrad) at room temperature.
The ATR-FTIR measurements were taken using a Bruker VERTEX 80 (Germany) combined platinum-diamond ATR with a diamond disc as an internal reflector in the range 4000-400 cm-1 with a resolution of 4 cm-1 and 50 scans. Absorption, reflectance, and transmittance spectra in the ultraviolet-visible spectrum were examined using a Jasco V-630 UV-VIS (Japan) spectrophotometer from 190-1100 nm. A PANalytical X'Pert Pro at 45 KV was used to study X-ray diffraction with a Cu-Kα target with secondary monochromator Holland radiation at 0.1540 nm with 2θ=5-70°.
The chemical structure of the Cr-39 is shown in scheme (1) [14,21].
Results and Discussion
X-ray diffractionThe X-ray diffraction spectra of pure Cr-39 and Cr-39 irradiated with 4, 6, 8, and 10 MRad are shown in Figure 1. It has been observed that the Cr-39 polymer contains a semicrystalline structure (crystalline and amorphous regions). It is found that the main characteristics crystalline peak at 2θ = 21.46°. The amorphous region showed a distinct diffraction halo from 2θ =36.92°-52.36°. After irradiation, it was found that there was a very slight change in the intensity of the X-yay spectra due to the different doses of gamma rays, which destroyed the original structure of Cr-39. The observed variations in the X-ray diffraction spectra are believed to result from the disordering of the initial structure of the Cr-39 polymer [22].
Moreover, a rise in peak intensity and an increase in the full width at half maximum (FWHM) are detected from the diffraction of irradiated Cr-39 polymer, which is often correlated with an increase in the degree of crystallinity of the polymer.
The degree of crystallinity (χc) is estimated from the area under the peak between the crystalline amorphous phases on the diffraction pattern from the relation:
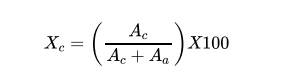
where Ac is the area under the crystalline peak at (2θ = 21.46°) and Aa the area under the semicrystalline peak centered at (2θ = 43.91°). The degree of crystallinity of 0, 4, 6, 8, and 10 Mrad are 68.2, 69.01, 70.33%, 70.82%, and 71.43%), respectively. Increasing irradiation doses show slight and significant gradient change in the Cr-39 diffraction pattern. This confirms the structural stability of the samples.
FT-IR spectroscopyFT-IR spectroscopy is a helpful technique for studying the physical and chemical properties of polymeric materials after irradiation. The variations were calculated based on the relative rise or decrease in the intensity of the characteristic bands associated with the functional groups contained in the polymers. The FT-IR transmittance spectra (in AT-IR mode) of the unirradiated Cr-39 and Cr-39 irradiated with 4, 6, 8, and 10 Mrad in the wavenumber range 4000-400 cm-1 at room temperature shown in Figure (1).
The spectra show the presence of two bands at 2919 and 2848 cm-1 are assigned to C-H stretching vibrations mode of the CO2 gas, the band at 1463 cm-1 is attributed to the CH2 bending vibrations, and the band at 718 cm-1 is due to ether groups. These bands have a linear decrease, with the doses increasing for all irradiated samples. These observations confirm a linear dependence of chain degradation with the doses [8,13,15,16]. This is due to the trapping of the spectral groups inside the Cr-39 leading to the decrease observed in the samples irradiated with high doses. THe intensity of the characteristic FT-IR bands of Cr-39 rises after irradiation, indicating an increase in the polymer's unsaturated behavior.
FT-IR spectroscopyFT-IR spectroscopy is a helpful technique for studying the physical and chemical properties of polymeric materials after irradiation. The variations were calculated based on the relative rise or decrease in the intensity of the characteristic bands associated with the functional groups contained in the polymers. The FT-IR transmittance spectra (in AT-IR mode) of the unirradiated Cr-39 and Cr-39 irradiated with 4, 6, 8, and 10 Mrad in the wavenumber range 4000-400 cm-1 at room temperature shown in Figure (1).
The spectra show the presence of two bands at 2919 and 2848 cm-1 are assigned to C-H stretching vibrations mode of the CO2 gas, the band at 1463 cm-1 is attributed to the CH2 bending vibrations, and the band at 718 cm-1 is due to ether groups. These bands have a linear decrease, with the doses increasing for all irradiated samples. These observations confirm a linear dependence of chain degradation with the doses [8,13,15,16]. This is due to the trapping of the spectral groups inside the Cr-39 leading to the decrease observed in the samples irradiated with high doses. The intensity of the characteristic FT-IR bands of Cr-39 rises after irradiation, indicating an increase in the polymer's unsaturated behavior
Optical propertiesFigures (2 and 3) show the absorbance and transmission spectra of the unirradiated Cr-39 and Cr-39 irradiated with 4, 6, 8, and 10 Mrad in the wavelength range 190-2500 Hz at room temperature, which studies the optical properties of samples before and after irradiation.
Figure (2) shows the optical absorbance curves over the wavelength region ranging from 2500 to 1900 nm for the unirradiated Cr-39 and Cr-39 gamma-irradiated with 4, 6, 8, and 10 Mrad.
The optical absorbance of the irradiated sample is lower than that of the unirradiated Cr-39 pure sample, with a much greater decrease observed in the UV region. The decrease in optical absorbance may be increased by the increase in optical absorption and scattering by the new molecular species and gases produced by the doses [23,24]. In conclusion, AT-IR and UV-Vis spectral studies on irradiated Cr-39 plastics can provide further understanding and information on the radiation-induced degradation and, consequently, the track registration properties of this Cr-39 polymer.
The transmission spectra in the wavelength range 190–1200 nm of the samples, as seen in Figure (3). The transmittance of the non-irradiated (pure Cr-39) sample is 91% higher than that of the irradiated ones. Additionally, the transmissivity region varies from 510 to 1100 nm and is unaffected by irradiation doses. Furthermore, after irradiation, the transmission magnitude reduces from 91% to 71%. It was found that the optical transmittance increases rapidly in the ultraviolet range (337-546 nm) until it reaches an almost constant value in the visible range of 460-1110 nm.
Meanwhile, the optical transmittance increases with increasing wavelength and gradually increasing radiation doses. Moreover, a red shift in cutoff wavelength (λcutoff) is seen following irradiation, indicating that the fundamental absorption edge of the examined samples has decreased.
Optical parameters are used to examine and gain a deeper understanding of the electronic properties of prepared samples [25].
The absorption coefficient (α) of prepared samples is given by
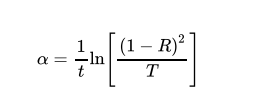
where t is the thickness of the sample, R is the absorbance, and T is the transmission. Figure (4) shows the absorption coefficient (α) of prepared samples. Strong absorption is observed for all samples with the increase in energy through the UV-Vis region, attributing to the electronic transitions in this spectral region. The spectrum of pure Cr-39 polymer depicts its presence of a π-π* transition that appears at 199 nm (3.71 eV). In addition, the activation energy of the irradiated samples decreased with increasing irradiation doses at 221 nm to 3.71 eV.
With a deeper look to study the absorption spectrum of the samples, three regions can be seen in this spectrum: a linear absorption region, which is the Tauc region, then an exponential region, which is the Urbach region, and then a weak absorption tail. The Tauc region indicates interband transitions between the extended states of both the valence and conduction bands. Thus, it provides an evaluation of the optical band gap.
The optical energy gap (Eg) according to the Tauc relation can be calculated as [4,25,26]:
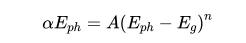
where A is a constant, Eph is the energy of incident photons, and n is a power factor that refers to the method of electronic transition between domains. A direct allowed transition is studied at n = 0.5, and n= 1/2 for an indirect allowed and direct forbidden, respectively [21].
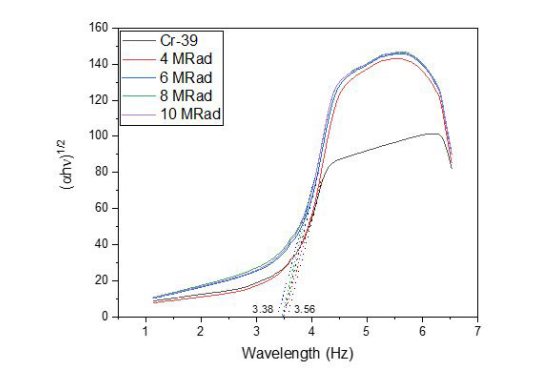
After the irradiation process, changes occurred in the optical band-gap values of all samples. New groups of localized states, generated by the induced chaos, diffuse near the valence and conduction band edges and act as trapping and recombination centers. Figures 5 and 6 show the relations between (αEph) 2 and (αEph) 1/2 as a function of Eph. The estimated values of the optical band gap (Eg) can be derived from the intersection of the linear part in the high absorption region with the x-axis in the figures, respectively. The values of Eg are recorded in Table 1.
In connection with the fact that adhesives of the optical components, optical waveguides, and anti-reflective use materials with high refractive indices, the refractive index (R) of the samples is calculated from the relation [27]:
The values of n are recorded in Table 1. These values of n are increased slightly after irradiation of the samples, as the refractive index causes the packing density of the samples to increase.
The extinction coefficient (k) demonstrates the differences in absorption when a wavelength travels through a material wavelength and describes the absorption differences as the electromagnetic wave propagates through the material. The following equation denotes the extinction coefficient (k) [28]:
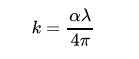
where λ is the wavelength.
The plot between the extinction coefficients (k) versus wavelength (λ) of the present samples is shown in Figure (7). The extinction coefficient of the sample peak at λ= 199 nm increases with increasing wavelength up to 221 nm as irradiated doses increase which is caused by surface plasmon absorption in irradiated samples.
Conflict of Interest
The authors declare that there is no conflict of interest regarding the publication of this paper
Funding
The authors declare that no funds, grants, or other support were received during the preparation of this manuscript.
Author Contributions
IS Elashmawi supervised the findings of this work, writing-original draft, review, and editing. AM Abdelghany contributed to sample preparation, analysis, investigation, and writing-original draft conceived of the presented idea. All authors discussed the results and contributed to the final manuscript.
Conclusion
In the present work, the Cr-39 polymer detector was studied before and after irradiation by different doses of gamma radiation (4, 6, 8, and 10 Mrad). the crystalline X-ray peak was observed at 2θ = 21.46°, and the amorphous region halo was recorded in the range from 2θ =36.92°-52.36°. A very slight change in the intensity of the X-ray spectra due to the different doses of gamma rays con- firms the structural stability of the Cr-39. With the doses increasing, a linear decrease in IR bands occurred for all irradiated samples due to the trapping of the spectral groups inside the Cr-39 leading to the decrease observed in the samples irradiated with high doses. e optical absorbance and transmittance of the irradiated sample were lower than that of the unirradiated sample. The transmittance of the non-irradiated (pure Cr-39) sample was 91% higher than that of the irradiated ones. Furthermore, after irradiation, the transmission magnitude reduces from 91% to 71%. After the irradiation process, changes occurred in the optical band-gap values of all samples with groups of localized states generated by the induced chaos, diffusing near the valence and conduction band edges. These values of the refractive index (n) and the extinction coefficient (k) were increased slightly after irradiation.
- MF Zaki (2008) “Radiation Effects & Defects in Solids Particularization of α contamination using CR-39 track detectors,” 0150.
- BA El-badry, MF Zaki, TM Hegazy, M Hany (2010) “Ion beam modification of surface properties of CR-39, 6435.
- NUVNIR Range et al. (2018) “CR-39 (PADC) Reflection and Transmission of Light in the Ultraviolet 72: 591–7,
- ISEAA Al Muntaser (2021) “Influence of Co 3 O 4 Nanoparticles on the Optical, and Electrical Properties of CMC / PAM Polymer: Combined FTIR / DFT Study,” J. Inorg. Organomet. Polym. Mater 2: 0123456789.
- M El-deep, F Abdel-wahab, N El-faramawy, H Abdelmaksoud (2021) “Influence of irradiation of CR-39 with α - particles on the optical dispersion parameters: Role of chemical etching to develop nuclear tracks,” Radiat. Phys. Chem 193: 109965.
- H Afifi, A El-sersy, N Khaled (2010) “The use of ultrasonic properties of cr-39 track detectors in neutron dosimetry THE USE OF ULTRASONIC PROPERTIES OF CR-39,” 0150.
- M House (2006) “Response function of the plastic track detector CR-39,” no. February 37-41.
- A Srivastava, T Singh, AL Sharma, PK Jain, CRRA Jan, C Taylor (2013) “STUDY OF Heavy Ion Modified Cr-39 (Diethyleneglycol Bisallyl Carbonate) 0150.
- TW Jeong et al. (2017) “CR-39 track detector for multi- -MeV ion spectroscopy,” 2-9,
- P Taylor, MF Zaki, EK Elmaghraby (2008) “Photoluminescence of irradiation induced defects on CR-39,” no. November 37-41.
- SS Chavan, HK Bagla (2020) “Measurements of alpha radioactivity in thermal power plant effluents employing CR-39 detector based improved alpha track detection method,” J. Environ. Radioact 233: 106574.
- MA Rana (2019) “Nuclear Inst. and Methods in Physics Research, A Summary of a comprehensive data bank for nuclear track research using CR-39 detectors,” Nucl. Inst. Methods Phys. Res. A 944: 162590.
- M Hassouba, N Dawood (2021) “Comparison of Surface Modification of CR-39 Polymer Film Using RF and DC Glow Discharges Plasma 2021-33.
- M Chawla, D Gupta, N Shekhawat, S Ojha, S Aggarwal (2018) “Surface characteristics of nitrogen ion implanted CR-39 polymer: RBS,” Vacuum 160: 89-94
- VD Kv, J Ramkumar, S Chandramouleeswaran (2017) “Application of organic polymer in the identification of radioactive pu isotopes,” 1: 141-3,
- S Singh, S Prasher (2004) “UV – VIS spectroscopic and etching studies of IR exposed CR-39 plastic track detector,” 215: 169-73,
- S Kalia et al. (2014) “The Optical and Chemical Response of Thermal Neutron-Irradiated CR-39 Polymeric Track Detector after Annealing the Optical and Chemical Response of Thermal Neutron-Irradiated CR-39 Polymeric Track,” 2559.
- SK Raghuvanshi et al. (2012) “Effect of γ -irradiation on optical and chemical properties of CR-39 polymer,” 0150.
- Y Yao et al. (2022) “Comparison of morphological characteristics for alpha tracks in CR-39 using different radon monitors,” Radiat. Meas 160: 106895.
- KM Thabayneh, MY Shoeib (2018) “Journal of the Association of Arab Universities for Basic Studying some properties of CR-39 detector under the effect of different gamma doses Studying some properties of CR-39 detector under the effect of different gamma doses,” J. Assoc. Arab Univ. Basic Appl. Sci 20: 55-60.
- H Search, C Journals, A Contact, M Iopscience, IP Address (2008) “Gamma-induced modification on optical band gap of CR-39 SSNTD,” 175404.
- V Kumar, RG Sonkawade, SK Chakarvarti, P Singh, AS Dhaliwal (2012) “Carbon ion beam induced modifications of optical, structural and chemical properties in PADC and PET polymers Carbon ion beam induced modifications of optical, structural and chemical properties in PADC and PET polymers,” Radiat. Phys. Chem 81: 652-8.
- D Ali, MZ. Butt, S Naseem (2013) “Characterization of laser-produced plasma ions of various metals and their effect on the optical properties of the CR-39 polymer,” 0150.
- E Mousa (2022) “on the electrical and optical properties of PVA for embedded electronics and optical applications,” J. Mater. Sci. Mater. Electron 33: 23088-106.
- AA Menazea, AM Ismail, IS Elashmawi (2020) “The role of Li 4 Ti 5 O 12 nanoparticles on enhancement the performance of PVDF / PVK blend for lithium-ion batteries,” Integr. Med. Res 9: 5689-98.
- IS Elashmawi, AA Al-muntaser, AM Ismail (2022) “Structural, optical, and dielectric modulus properties of PEO / PVA blend filled with metakaolin,” Opt. Mater. (Amst) 126: 112220.
- P Goyal, S Mahendia, R Gupta (2011) “Tuning of the refractive index and optical band gap of CR-39 polymers by heating.
- A Alsaeedi (2019) “Optical Properties of CR-39 Plastic Detectors Irradiated by He: Ne Laser.
Scheme 1
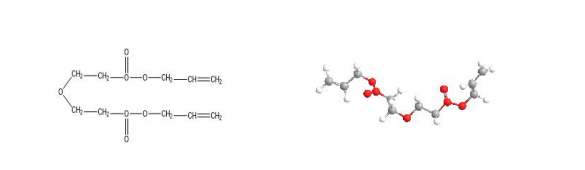
Scheme 1 The chemical structure of the Cr-39
FIGURE 1
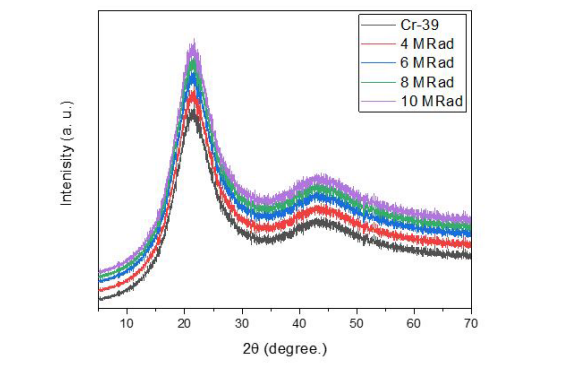
Figure 1: The X-ray diffraction spectra of pure Cr-39 and Cr-39 irradiated with 4, 6, 8, and 10 MRad
FIGURE 2
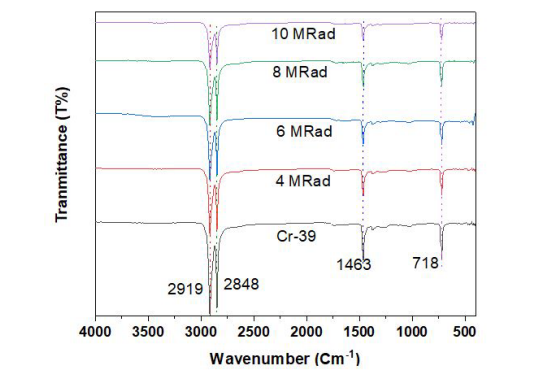
Figure 2: The FT-IR spectra of CR-39 before and after being irradiated with different gamma-ray doses
FIGURE 3
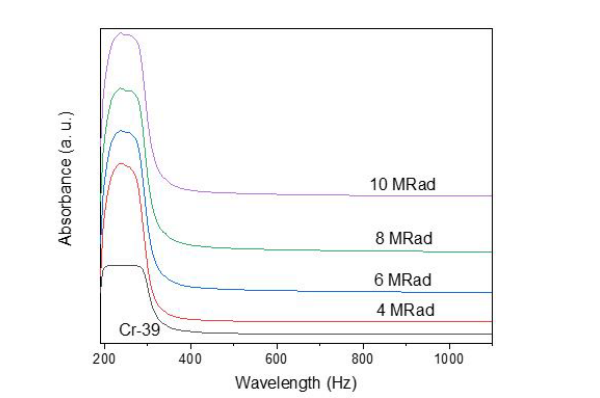
Figures 3 UV/Vis. absorbance spectra of the studied CR-39 before and after being irradiated with different gamma-ray doses
FIGURE 4
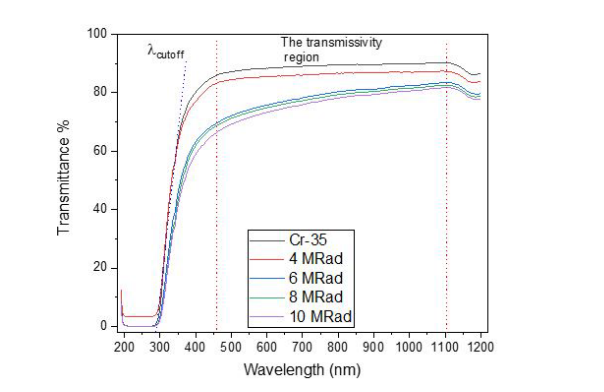
Figures 4: UV/Vis. transmittance spectra of the studied CR-39 before and after being irradiated with different gamma-ray doses
FIGURE 5
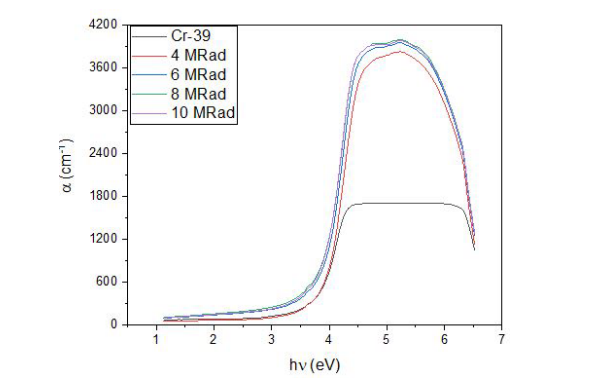
Figure 5:Absorption coefficient versus photon energy of the studied CR-39 before and after being irradiated with different gamma-ray doses
FIGURE 6
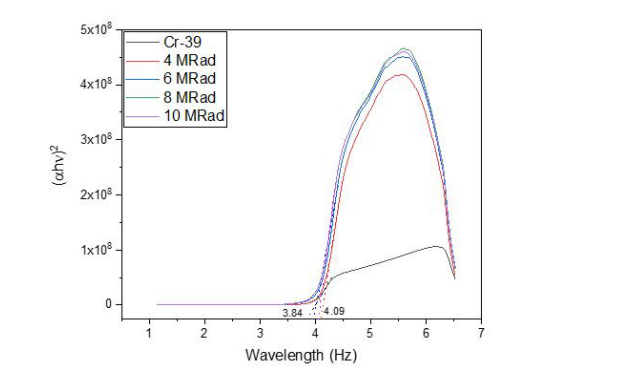
Figure 6: The relations between (αEph)1/2 as a function of Eph
FIGURE 7
Figures 7: The relations between (αEph)2 as a function of Eph
FIGURE 8
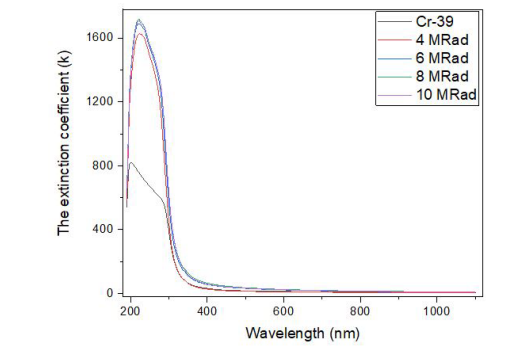
Figures 8:the plot between the extinction coefficients (k) versus wavelength (λ) of the samples
Tables at a glance
Figures at a glance