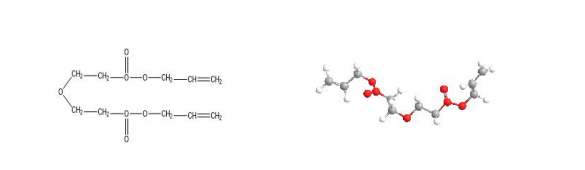
Scheme 1 The chemical structure of the Cr-39
Scheme 1 The chemical structure of the Cr-39
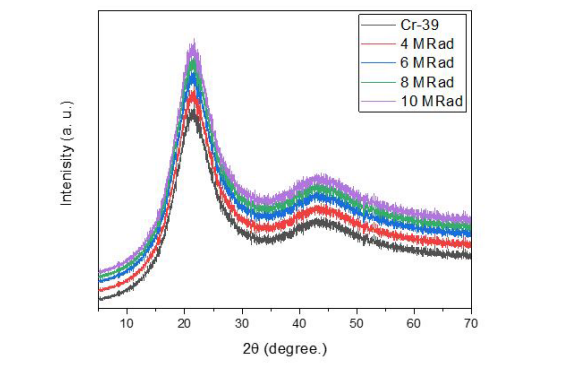
Figure 1: The X-ray diffraction spectra of pure Cr-39 and Cr-39 irradiated with 4, 6, 8, and 10 MRad
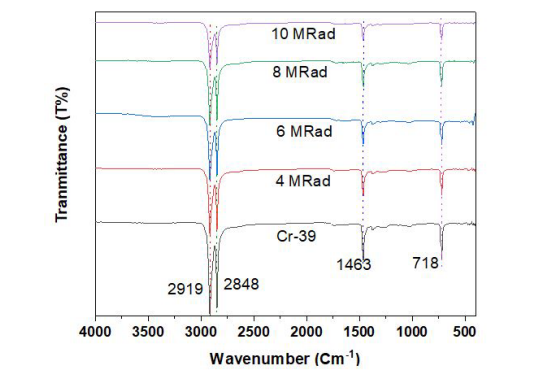
Figure 2: The FT-IR spectra of CR-39 before and after being irradiated with different gamma-ray doses
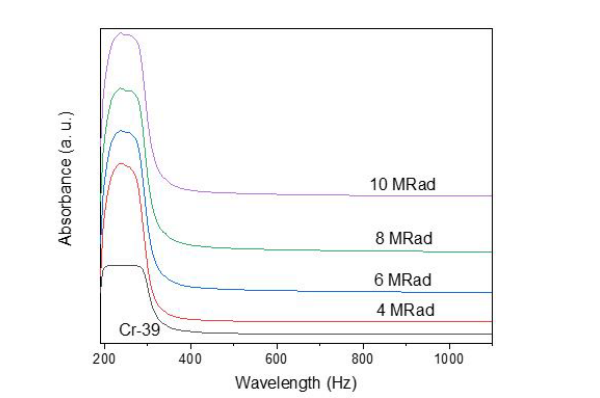
Figures 3 UV/Vis. absorbance spectra of the studied CR-39 before and after being irradiated with different gamma-ray doses
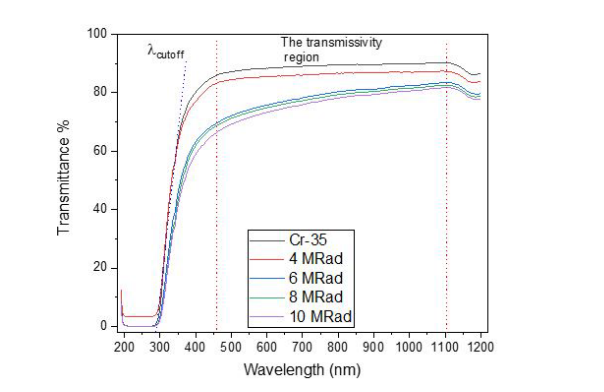
Figures 4: UV/Vis. transmittance spectra of the studied CR-39 before and after being irradiated with different gamma-ray doses
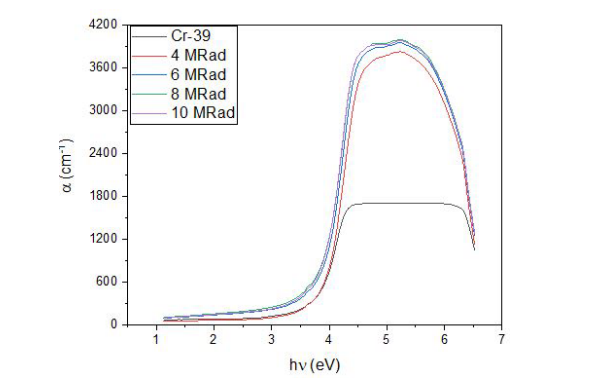
Figure 5:Absorption coefficient versus photon energy of the studied CR-39 before and after being irradiated with different gamma-ray doses
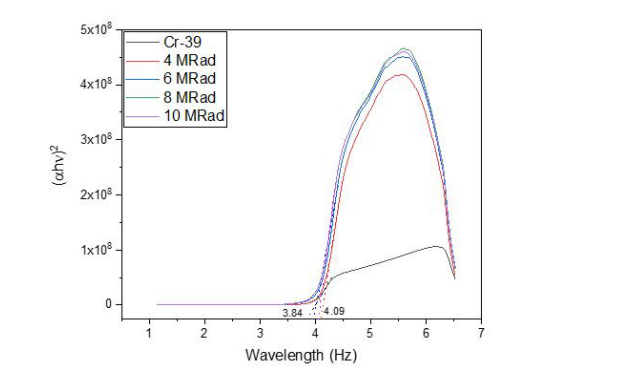
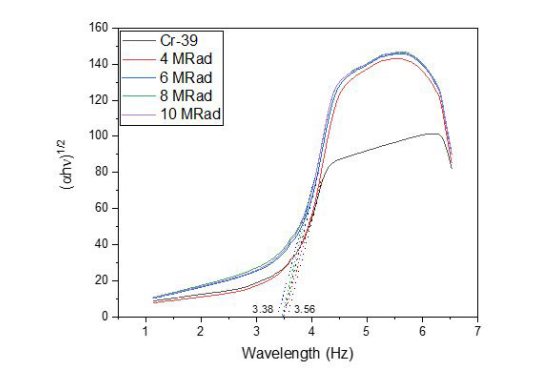
Figure 6: The relations between (αEph)1/2 as a function of Eph
Figures 7: The relations between (αEph)2 as a function of Eph
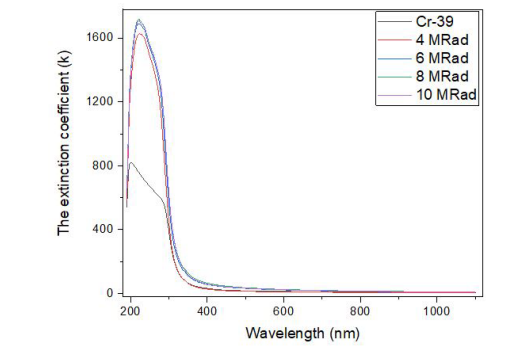
Figures 8:the plot between the extinction coefficients (k) versus wavelength (λ) of the samples
Tables at a glance
Figures at a glance