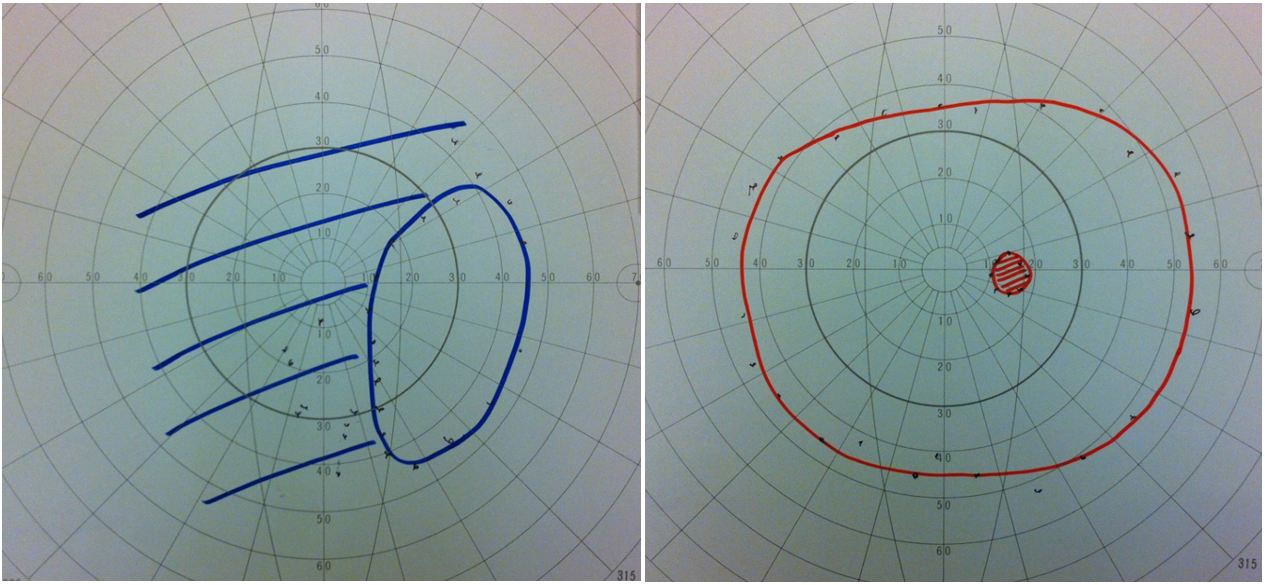
Figure 1 Goldmann visual field showing a gross scotoma over the left eye and a normal right visual field.
Figure 1 Goldmann visual field showing a gross scotoma over the left eye and a normal right visual field.
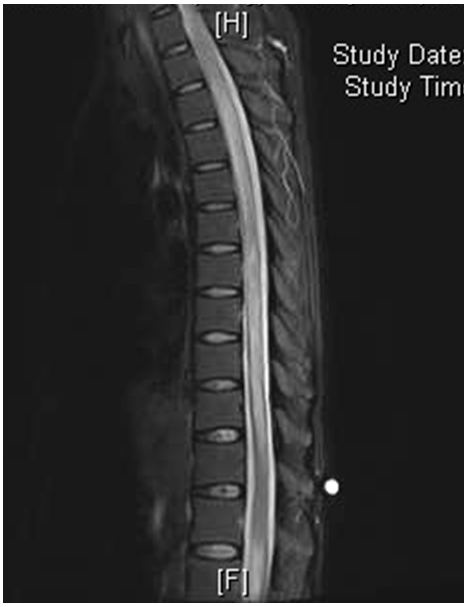
Figure 2 MRI spine showing extensive myelopathy from C2 to T12.
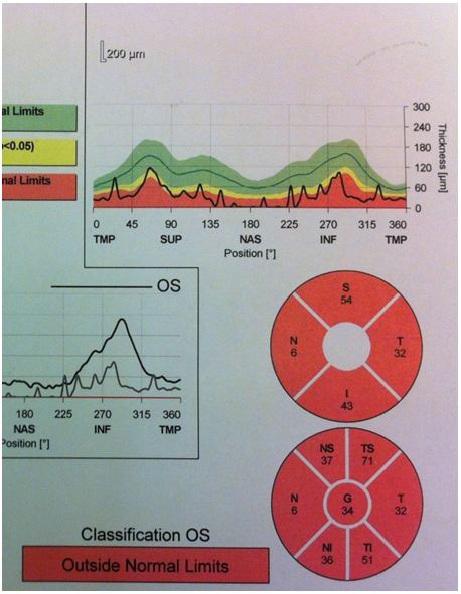
Figure 3 Spectralis OCT demonstrating generalized RNFL thinning over the left eye.