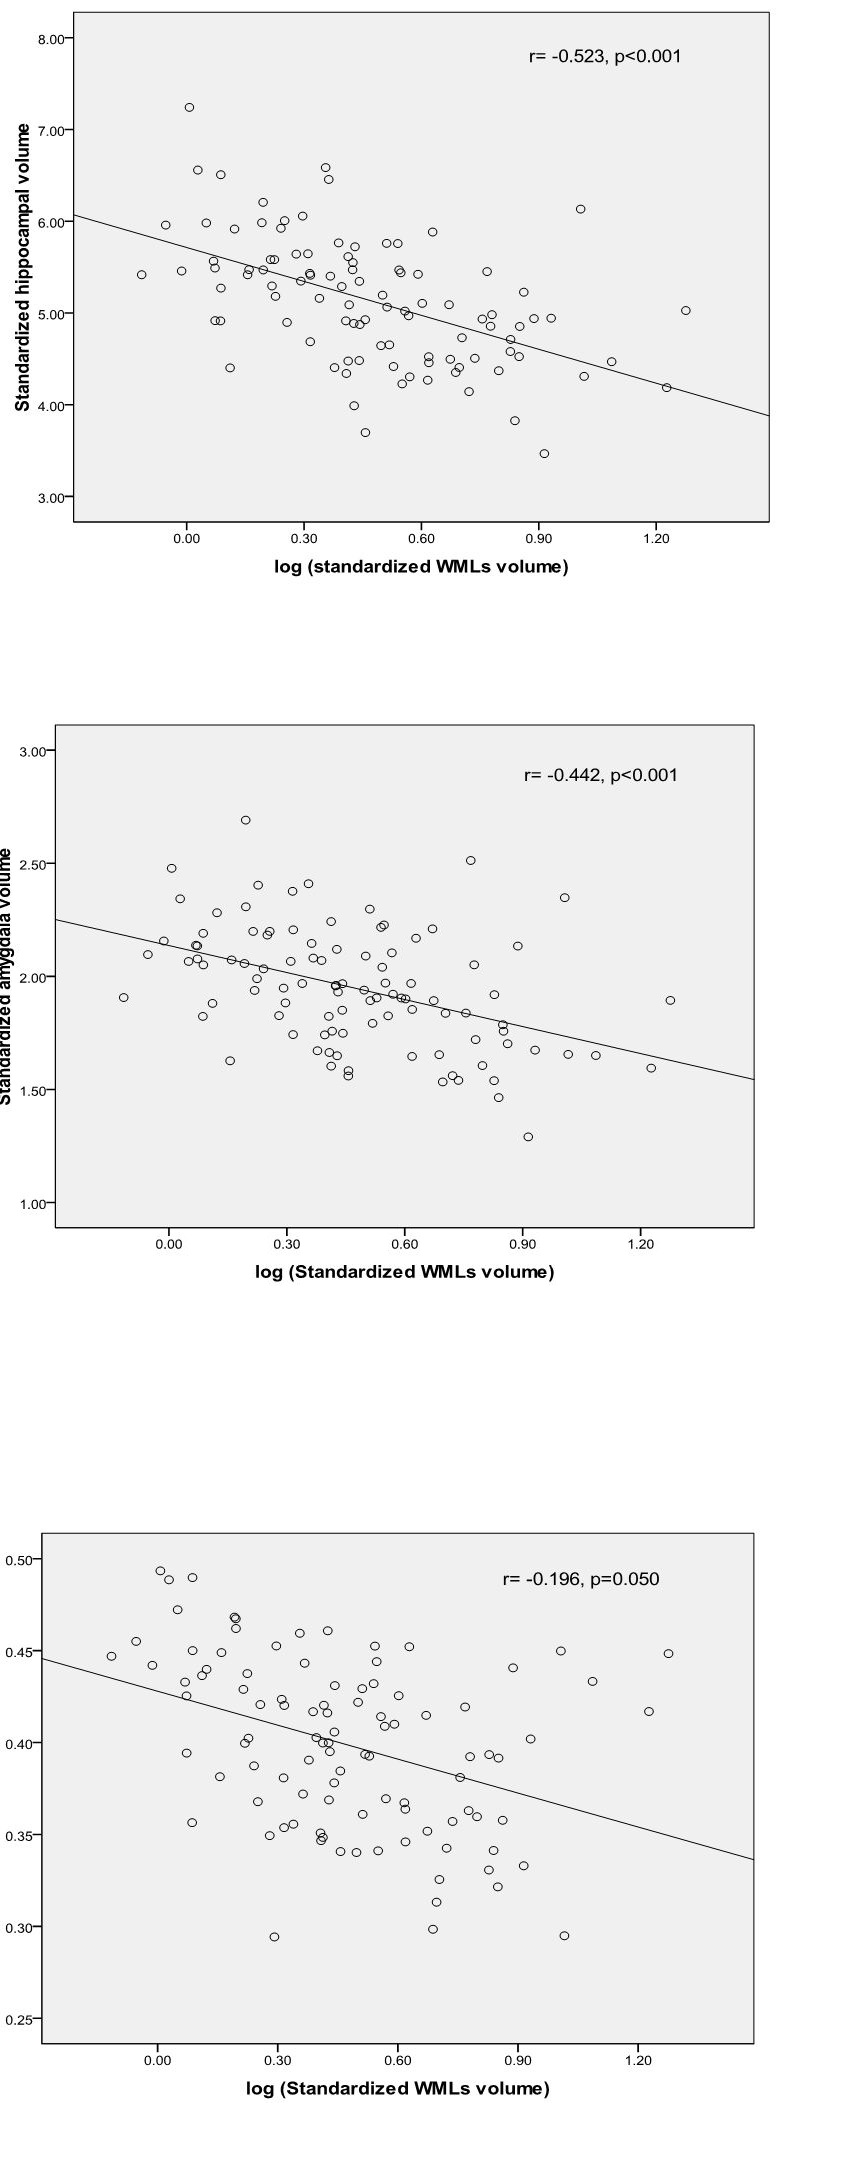
Figure 1 Scatter plots of WMLs volume and hippocampus, amygdale and CGM volume
Figure 1 Scatter plots of WMLs volume and hippocampus, amygdale and CGM volume
Table 1: Demographic and clinical characteristics of the subjects (n=100).
Variables |
Mean (s.d.)/n(%) |
Age |
69.0±8.7 |
Sex(male) |
62(62.0%) |
Education years |
5.1±3.6 |
Hypertension |
71(71.0%) |
Diabetes |
32(32.0%) |
Smoking history |
51(51.0%) |
Prior stroke |
11(11.0%) |
NIHSS on admission |
4.5±3.1 |
MMSE |
25.8 (3.2) |
GDS |
4.5 (3.9) |
Intracranial volume (cm3) |
1446.82 (173.62) |
Grey matter volume (cm3) |
574.12 (75.31) |
Grey matter / intracranial volume |
0.397 |
Hippocampal volume (cm3)* |
7.36 (0.91) |
White matter lesions volume (cm3) |
5.44 (4.22) |
NIHSS=the National Institutes of Health Stroke Scale; BI=Barthle index; MMSE=Mini-Mental State Examination; GDS= Geriatric Depression Scale. * The sum of left and right
Table 2: Clinical and imaging characteristics between smaller and larger volume groups in term of hippocampus, amygadala and cortical grey matter.
|
|
|
|
|||
|
smaller |
larger n=50 |
smaller |
larger n=50 |
smaller |
larger |
Clinical variables |
|
|
|
|
|
|
age |
71.9±9.3‡ |
66.1±7.4 |
71.9±8.6‡ |
66.1±8.2 |
71.5±7.9‡ |
66.4±9.1 |
sex(male) |
38(76.0%)‡ |
24(48.0%) |
34(68.0%) |
28(56.0%) |
37(74.0%)† |
25(50.0%) |
education years |
5.1±3.5 |
5.2±3.6 |
5.1±3.6 |
5.1±3.5 |
5.2±3.2 |
5.0±3.9 |
hypertension |
34(68.0%) |
37(74.0%) |
33(66.0%) |
38(76.0%) |
35(70.0%) |
36(72.0%) |
diabetes mellitus |
17(34.0%) |
15(30.0%) |
14(28.0%) |
18(36.0%) |
17(34.0%) |
15(30.0%) |
hyperlipidemia |
28(56.0%) |
27(54.0%) |
25(50.0%) |
30(60.0%) |
24(48.0%) |
31(62.0%) |
ischemic heart disease |
2(4.0%) |
4(8.0%) |
2(4.0%) |
4(8.0%) |
4(8.0%) |
2(4.0%) |
previous stroke |
7(14.0%) |
4(8.0%) |
7(14.0%) |
4(8.0%) |
6(12.0%) |
5(10.0%) |
smoking history |
30(60.0%)* |
21(42.0%) |
28(56.0%) |
23(46.0%) |
30(60.0%)* |
21(42.0%) |
MMSE |
25.6±3.5 |
26.0±3.1 |
25.7±3.2 |
25.9±3.3 |
25.9±3.3 |
25.7±3.2 |
GDS |
4.2±3.9 |
4.8±3.8 |
4.3±4.1 |
4.7±3.6 |
4.3±3.9 |
4.6±3.8 |
Imaging variables |
|
|
|
|
|
|
no of old lacunes |
0.9±1.6 |
0.6±1.0 |
0.8±1.6 |
0.6±1.0 |
0.8±1.4 |
0.6±1.3 |
no of old infarcts |
1.0±1.6 |
0.7±1.1 |
1.0±1.6 |
0.8±1.1 |
1.0±1.4 |
0.8±1.3 |
Std. volume of old infarcts |
1.2±3.2* |
0.1±0.1 |
1.0±2.2 |
0.5±2.4 |
1.0±3.0† |
0.3±1.2 |
Std. WMLs volume |
5.1±3.5‡ |
2.4±1.7 |
4.9±3.6‡ |
2.6±1.8 |
4.0±2.1‡ |
3.5±3.8 |
presence of CMBs |
14(28.0%) |
12(24.0%) |
12(24.0%) |
14(28.0%) |
16(32.0%) |
10(20.0%) |
no of CMBs |
1.3±2.9 |
0.9±3.2 |
1.2±2.9 |
0.9±3.1 |
1.3±2.8 |
0.9±3.2 |
*P< 0.1; †P< 0.05; ‡P< 0.01. MMSE= Mini-mental Status Examination; GDS= Geriatric Depression Scale; Std. WMLs volume = Standardized white matter lesions volume; CMBs= cerebral microbleeds.
Table 3: Logistic regression analysis of smaller volumes of the hippocampus, amygdale and cortical grey matter
Variables |
Smaller hippocampal |
Smaller Amygdala |
Smaller CGM volume |
|||
|
P |
OR (95%C.I.) |
P |
OR (95%C.I.) |
P |
OR (95%C.I.) |
Age |
0.098 |
1.060 |
0.033 |
1.062 |
<0.001 |
1.123 |
Sex(male) |
0.004 |
5.714 |
-- |
-- |
0.001 |
6.173 |
Std. WMLs volume |
0.004 |
1.869 |
0.070 |
1.042 |
0.317 |
0.903 |
Old infarcts volume |
0.139 |
2.919 |
-- |
-- |
0.204 |
1.151 |
Smoking history |
0.574 |
0.701 |
-- |
-- |
0.661 |
0.795 |
CGM= Cortical grey matter; Std. WMLs volume = Standardized white matter lesions volume; OR=odds ratio.