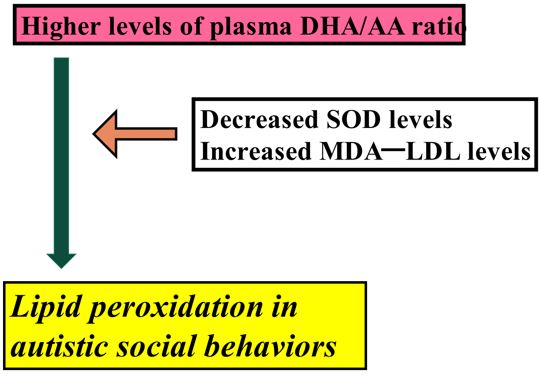
Figure1
Variables |
ASD |
Controls n=8 |
U |
p value |
Age (Year) |
10.9± 5.6 |
9.6 ± 4.0 |
63 |
0.64 |
Sex (male/female) |
12-06 |
05-03 |
χ2 = 0.042 |
0.84 |
Scores of Autism Diagnostic |
||||
Interview-Revised |
||||
Domain A (social) |
24.4 ± 3.7 |
N/A |
||
Domain B (communication) |
12.0 ± 2.3 |
N/A |
||
Domain C (stereotyped) |
10.8 ± 3.5 |
N/A |
||
Plasma biomarkers levels |
||||
Cp (mg/dl) |
28.17 ± 7.02 |
24.63 ± 6.78 |
55 |
0.37 |
Tf (mg/dl) |
275.39 ± 41.89 |
261.25 ± 24.07 |
56 |
0.4 |
MDA-LDL (mg/dl) |
91.00 ± 16.7 |
74.50 ± 18.88 |
36.5 |
0.047* |
SOD (U/ml) |
2.53 ± 0.46 |
5.36 ± 4.39 |
12.5 |
0.003* |
Total scores of the SRS |
83.39± 35.44 |
20.13 ±27.86 |
9 |
0.000*** |
Table1: Subject characteristics and plasma levels of and antioxidant proteins, and the ABC total Data are represented as mean ± SD (Mann-Whitney U test). * p<0.05, *** p <0.001, versus normal controls. Cp, ceruloplasmin; Tf, transferrin; SOD, superoxide dismutase; MDL- LDL, malondial-dehyde modified low-density lipoprotein; SRS, Social Responsiveness Scale
|
ASD (n = 7) |
Control (n = 5) |
U |
p value |
Age (years) |
11.4 ± 4.3 |
11.4 ± 3.2 |
14.0 |
0.87 |
Fat (g/day) |
72.2 ± 30.1 |
87.4 ± 25.8 |
12.0 |
0.43 |
Unsaturated fatty acid (g/day) |
14.8 ± 4.4 |
18.7 ± 5.5 |
9.0 |
0.2 |
Omega-3 PUFAs (g/day) |
2.6 ± 0.8 |
3.1 ± 0.5 |
9.0 |
0.2 |
Omega-6 PUFAs (g/day) |
12.1 ± 3.9 |
15.9 ± 5.1 |
11.0 |
0.34 |
EPA (mg/day) |
181.2 ± 118.7 |
176.2 ± 73.6 |
15.5 |
0.76 |
DHA (mg/day) |
332.6 ± 170.4 |
345.0 ± 83.31 |
15.5 |
0.76 |
ARA (mg/day) |
168.1 ± 17.1 |
221.0 ± 87.7 |
11.5 |
0.34 |
Protein (g/day) |
78.1 ± 25.8 |
89.2 ± 25.8 |
13.0 |
0.53 |
Animal protein (mg/day) |
32.0 ± 9.1 |
30.4 ± 14.7 |
14.0 |
0.64 |
Cholesterol (mg/day) |
139.1± 186.4 |
31.9 ± 10.3 |
17.0 |
1.00 |
Carbohydrates (g/day) |
286.2 ± 62.1 |
304.21 ± 72.4 |
14.0 |
0.64 |
Copper (mg/day) |
1.0 ± 0.2 |
1.3 ± 0.5 |
7.0 |
0.56 |
Iron (mg.day) |
7.4 ±1.6 |
9.2 ± 3.5 |
6.0 |
0.41 |
EPA, eicosapentaenoic acid; DHA, docosahexaenoic Acid; ARA, arachidonic acid. Values are mean±SD.
Table2: The intake of nutrients in the random subsamples of 7 of the 17 individuals and 5 of the 7 normal controls.
Model |
Model |
Model |
Coefficients B |
Beta coefficients |
p value |
DHA |
0.991 |
0.000** |
|||
α-linolenic acid |
0.535 ± 0.155 |
0.107 |
0.013 |
||
DPA |
0.498 ± 0,193 |
0.088 |
0.04* |
||
GLA |
-1.166± 0,306 |
-0.157 |
0.007* |
||
SODd |
0.036± 0.015 |
-0.170 |
0.03* |
||
SRS total |
0.000009 ± 0.001 |
0.092 |
0.057 |
||
Group (1 = ASD, 2=control) |
-0.057 0.102 |
-0.26 |
0.591 |
||
DHA.ARA |
0.972 |
0.000** |
|||
ARA |
-0.057 ± 0.102 |
-0.541 |
0.01* |
||
α-linolenic acid |
- 0.267 ± 0.102 |
- 0.316 |
0.04* |
||
Adrenic acid |
- 0.070± 0.147 |
- 0.037 |
0.65 |
||
SOD |
0.016 ± 0.015 |
0.242 |
0.326 |
||
SRS total score |
0.000009 ± 0.001 |
-0.023 |
0.901 |
||
Group (1 = ASD, 2=control) |
0.020 ± 0.057 |
0.05 |
0.731 |
R2, R-squared values; B, Unstandardized coefficients; SOD Superoxide dismutase; MDL-LDL,malondialdehyde-modified low-density lipoprotein; SRS, Social Responsiveness Scale
Table3: Results of the multiple linear regression analysis.
|
Standardized |
SE |
95% CI Lower bound Upper bound |
P-value |
|
ABC total scores |
|
|
|
|
|
DHA/ARA |
61.155 |
27.353 |
7.544 |
114.766 |
0.025 |
MDA-LDL |
|
|
|
|
|
DHA/ARA |
5.633 |
15.921 |
-25.572.32 |
36.837 |
0.723 |
DHA, docosahexaenoic acid; ARA, arachidonic acid; MDL-LDL, malondialdehyde- modified low-density lipoprotein; SOD, superoxide dismutase
Table4: Results of adaptive Lasso
Tables at a glance
Figures at a glance