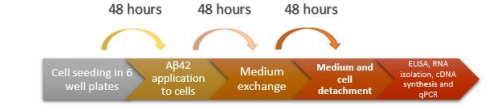
Figure 1: Stages of AD Model Forming. The timetable of different stages of creating the AD model with SH-SY5Y cell lines
Figure 1: Stages of AD Model Forming. The timetable of different stages of creating the AD model with SH-SY5Y cell lines
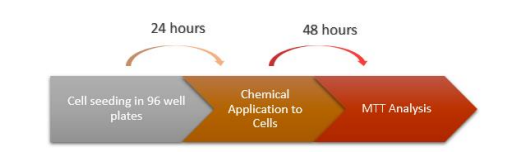
Figure 2: Chemical Application Stages to SH-SY5Y Cells. The timetable for application of different inhibitors of methyltransferases in the AD model cell lines
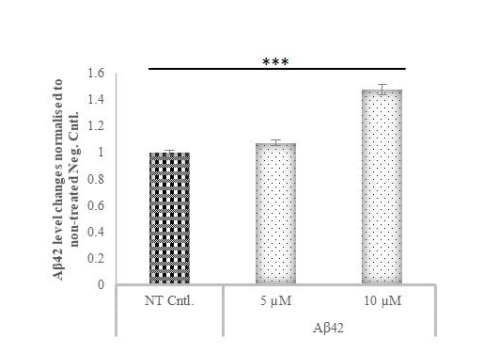
Figure 3: Aβ42 levels in cell media after treatment with two different concentrations of Aβ42 compared to the control group
Aβ42 levels in media after treatment with Aβ42 protein at 5 and 10 μM compared with the control groups by ELISA. Cells treated with 10 μM
Aβ42 produced more Aβ42 than cells treated with 5 μM. All results were determined according to the kit standards obtained by measurement
at 450 nm and by calculating the regression value (R2
=0.8394). *** p≤value = 0.001.
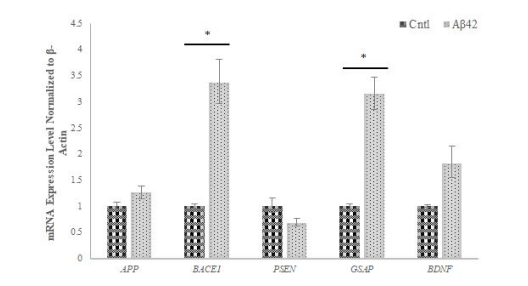
Figure 4: Gene expression profiling of AD-related selected genes
It was observed that the expression of APP, BACE1, GSAP and BDNF genes increased in Aβ42 cells compared to the control, while the expression of the PSEN gene decreased compared to the control. The data represent the mean mRNA expression level of selected genes normalized to β-Actin ± Standard Deviation (SD) from three independent experiments performed in duplicate. * p≤value = 0.05.
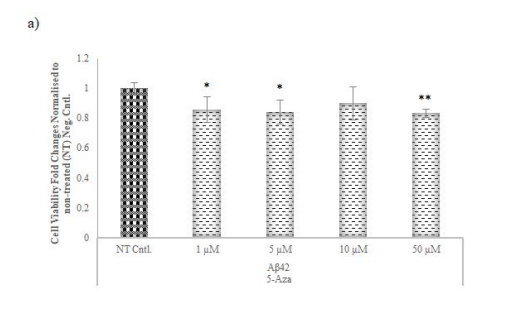
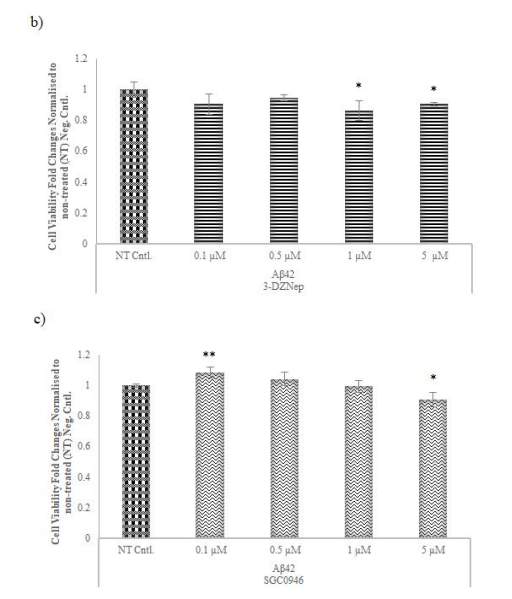
Figure 5: Cell viability assay for AD-modelled cell lines with different concentrations of the chemicals used to inhibit the selected methyltransferases. To examine the optimal dosage of chemicals used to inhibit the activity of a) 5-Azacytidine, b) 3-Deazanoplanocin, c) and SGC0946 of methyltransferases MTT assay performed after 48 hours in AD-modelled SH-SY5Y cell lines
Cell viability in Aβ42 cells treated with 5-Aza and 3-DZNep was reduced relative to NT at each concentration. An increase in cell viability was observed in Aβ42 cells treated with SGC0946 compared to NT cells at minimum concentration, and a decrease in cell viability was observed depending on the high concentrations. * p≤value = 0.05 and ** p≤value = 0.01.
Figure 6: Aβ42 Protein level changes after chemical application in AD-modelled cell lines
Aβ42 Protein levels in media after treatment with 10 μM of Aβ42 protein and chemicals used to inhibit the activity selected methyltransferases compared with the non-treated SH-SY5Y negative control by ELISA. Aβ42 level increased in Aβ42 NT cells compared to SH-SY5Y negative control. Histone and DNA methyltransferase inhibitors applied to AD-modelled cells reduced Aβ42 levels by 15%, 17%, and 10% in 5- Azacytidine, 3-Deazaneplanocin, and SGC0946 treated cells compared to NT control cells, respectively. All results were determined according to the kit manual and standards obtained by measurement at 450 nm and by calculating the regression value (R2 =0.99). ** p≤value = 0.01.
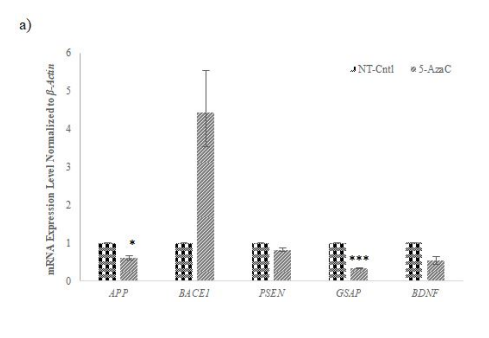
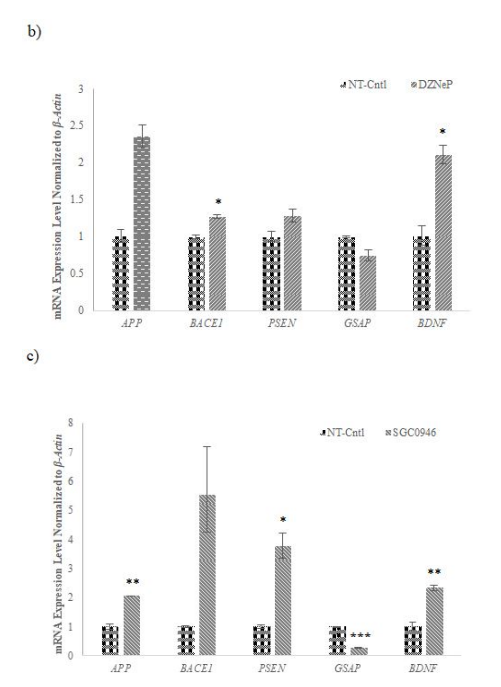
Figure 7: Gene expression profiling of AD-related selected genes in AD-modelled cell lines treated with different chemicals used to inhibit the selected methyltransferases
mRNA expression levels of selected AD-related genes normalized to housekeeping gene expression level performed by qRT-PCR for a) 5-Azacytidine (5-Aza, 1 μM), b) 3-Deazanoplanocin (3-DZNep, 1 μM), c) and SGC0946 (5 μM) of methyltransferases after 48 hours. While the expression of BACE1 increased with 5-Aza application, the expression of other genes decreased compared to NT cells. While the expression of the GSAP gene decreased in cells treated with 3-DZNep and SGC0946, the expression of other genes increased compared to NT cells. The data represent the mean mRNA expression level of selected genes normalized to β-Actin ± SD. from three independent experiments performed in duplicate. * p≤value = 0.05, ** p≤value = 0.01, *** p≤value = 0.001.
Tables at a glance
Figures at a glance