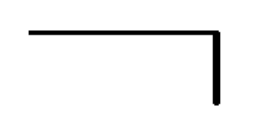
Figure 1 a: Two interconnected brain subsystems for attention. The subsystem maintaining the goal is presented here as the horizontal line, the subsystem sharply interrupting this attention corresponds to the vertical line
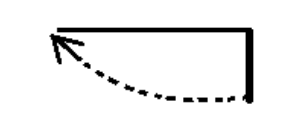
Figure 1 b: The attention subsystems interact in a natural state, after which a reboot (dotted line) is semi-artificially performed
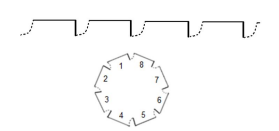
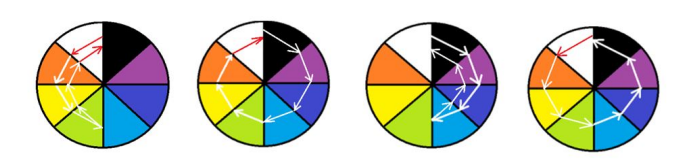
Figure 1 c: A chain of looped attention subsystems is presented at the top. In reality, this can create a cyclic structure from 8 sequential mood states. The dotted curves correspond to the stages of semi-artificial restart of the pair of attention subsystems.
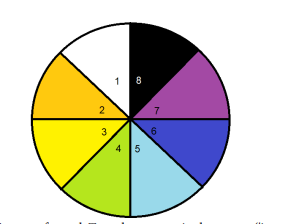
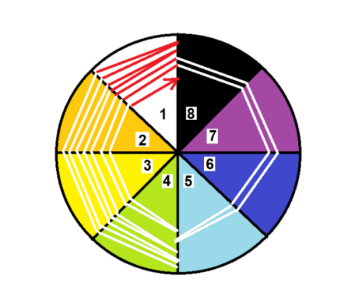
Figure 1 d: The circle of mental states / states of mood. Two almost emotionless states ('input'(#1) and 'output' (#8)) are represented by two colorless sectors ‑ white and black, while the other states are the sectors in the figure, colored in various colors of the rainbow; they are clearly associated with good and bad moods of different intensity and specificity. The sectors of the extremes of good and bad moods are colored, respectively, yellow (#3) and blue (#6).

Tables at a glance
Figures at a glance