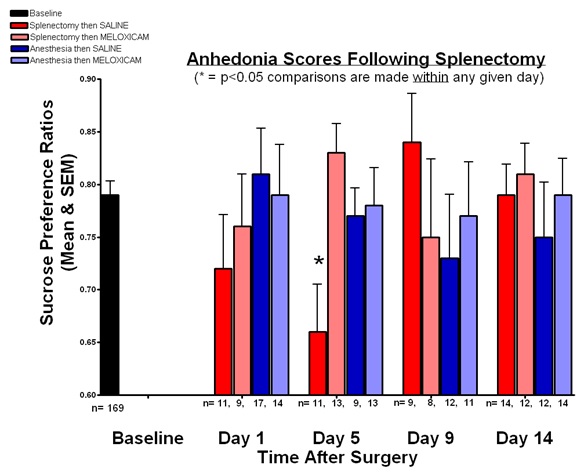
Figure 1: Anhedonia scores following splenectomy.
Figure 1: Anhedonia scores following splenectomy.
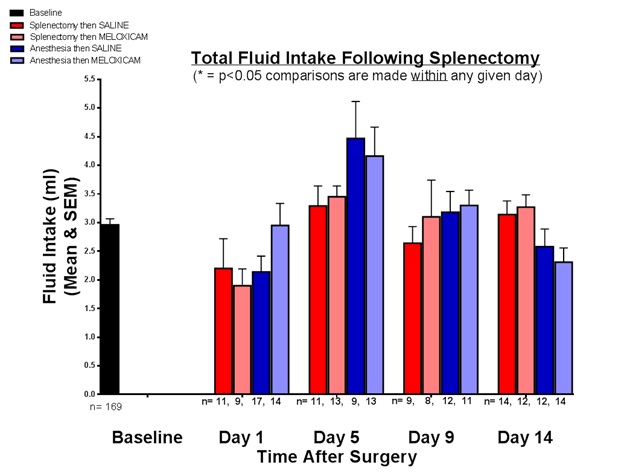
Figure 2: Total fluid intake following splenectomy.
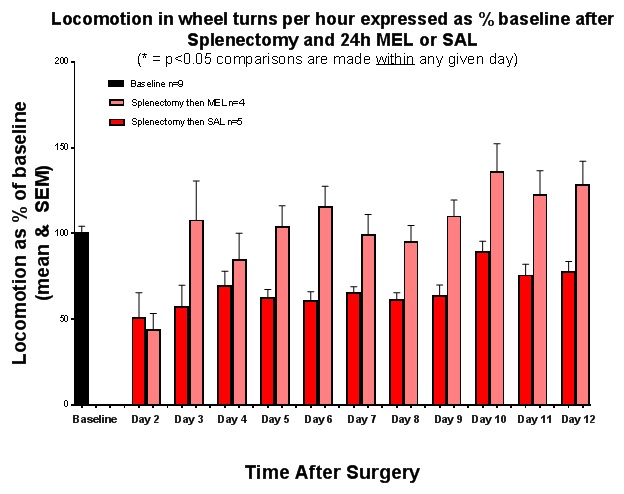
Figure 3: Locomotion in wheel turns per hour expressed as percentage of baseline after splenectomy and 24h MEL or SAL.
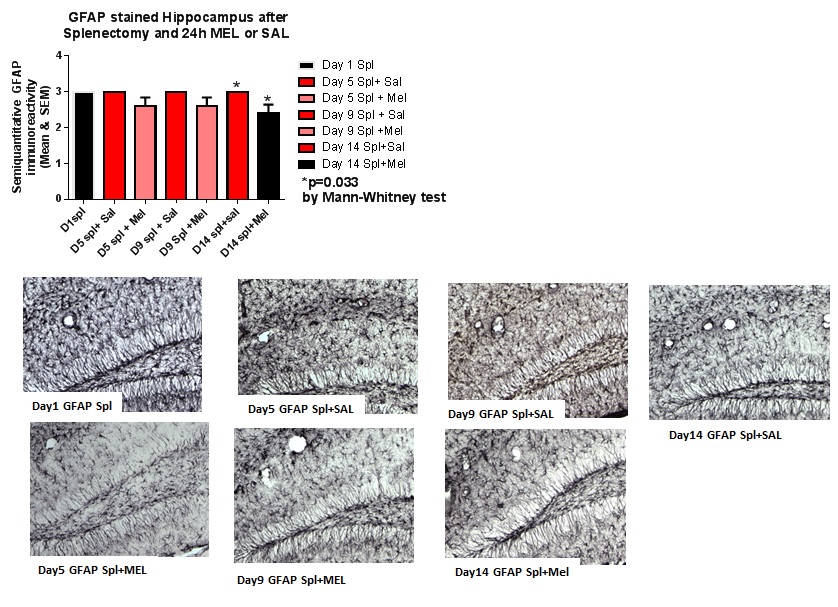
Figure 4: GFAP-stained hippocampus after splenectomy and 24h MEL or SAL.
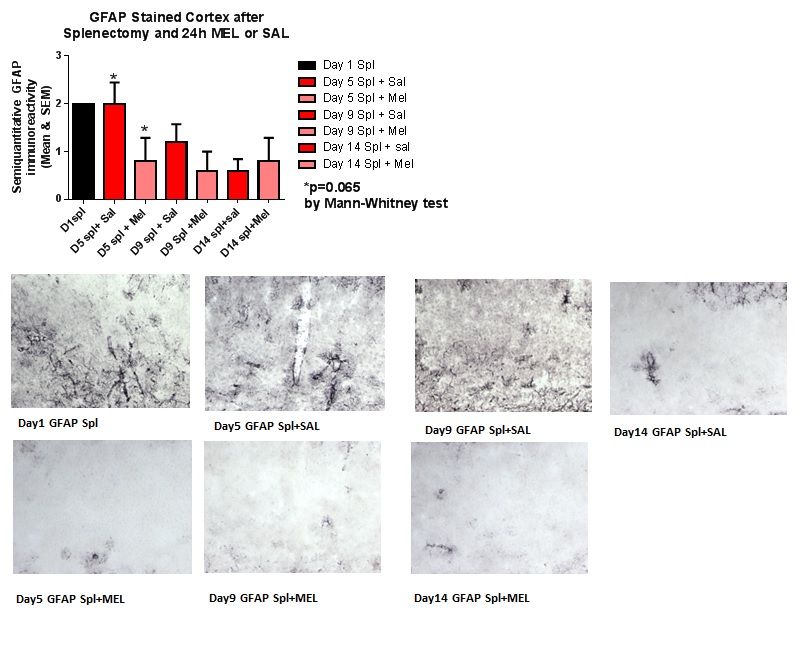
Figure 5: GFAP-stained cortex after splenectomy and 24h MEL or SAL.
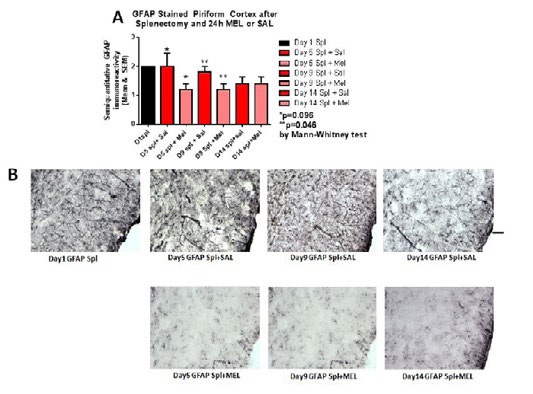
Figure 6:GFAP-stained piriform cortex after splenectomy and 24h MEL or SAL.
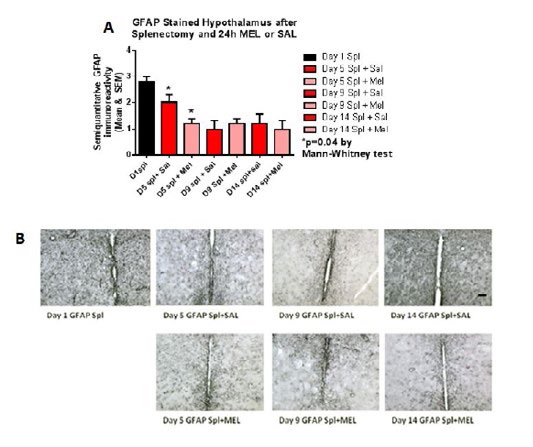
Figure 7:GFAP-stained hypothalamus after splenectomy and 24h MEL or SAL.
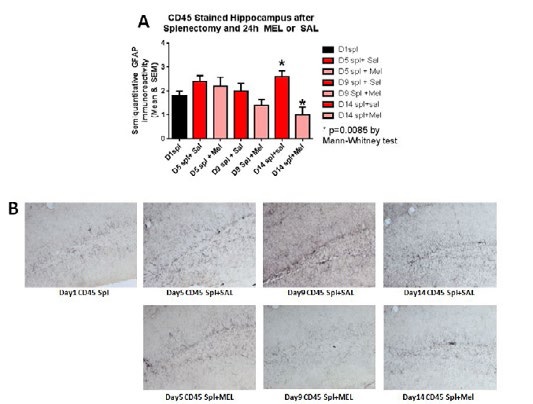
Figure 8:CD45-stained hippocampus after splenectomy and 24h MEL or SAL.
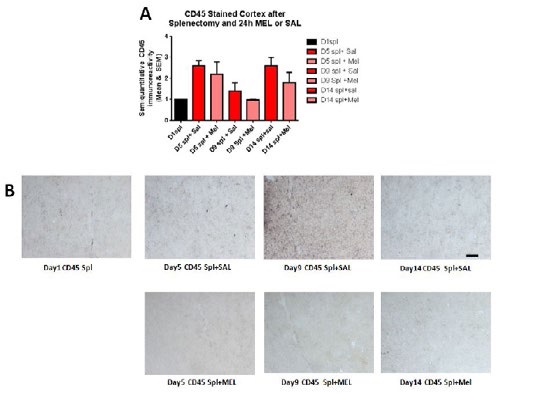
Figure 9:CD45-stained cortex after splenectomy and 24h MEL or SAL.
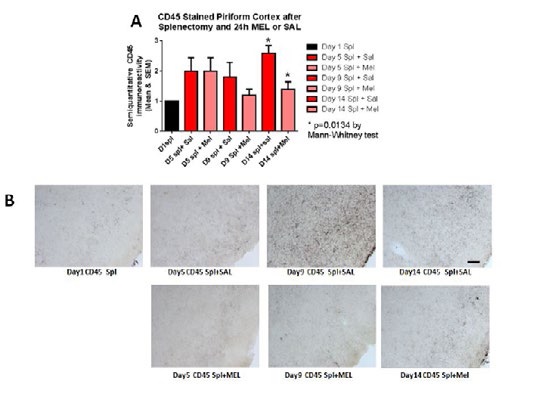
Figure 10:CD45-stained piriform cortex after splenectomy and 24h MEL or SAL.
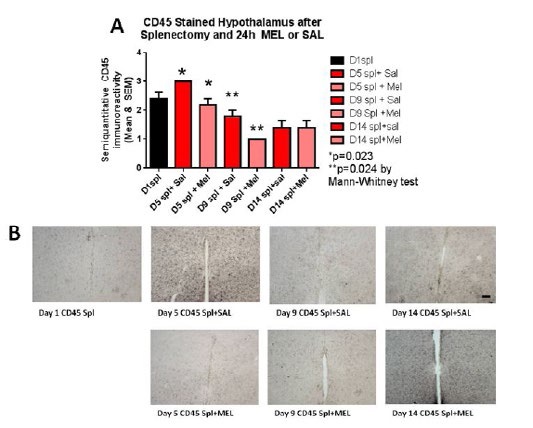
Figure 11:CD45-stained hypothalamus after splenectomy and 24h MEL or SAL.
Figures at a glance