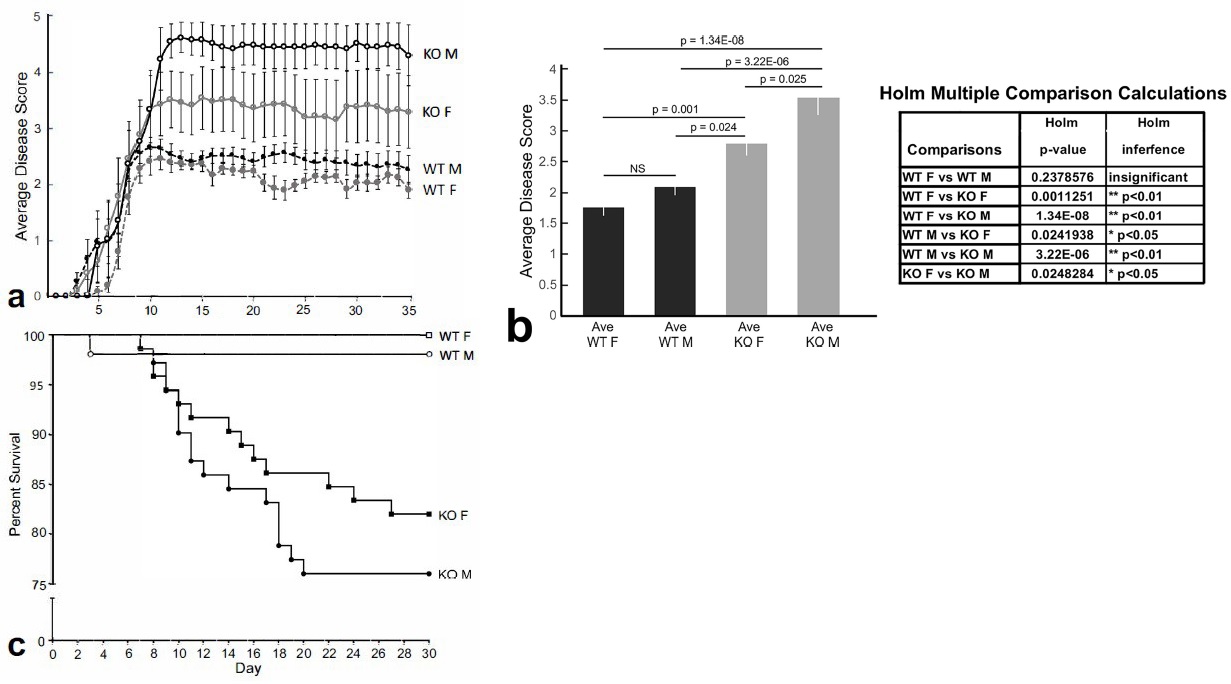
Figure 1 a-c. CD44-KO mice suffer from increased EAE disease severity compared to WT mice and CD44-KO.

a.Average daily clinical disease scores of WT male, WT female, CD44-KO male and CD44-KO female mice following induction of EAE. Mortality scores were included in average scores from the time of death throughout the study. Data are expressed as means +/- standard errors.

b. Average clinical disease score over the course of the disease was calculated by averaging the disease scores experienced by each mouse over the 30 day study period and is then represented as a mean per group. Analysis of the average clinical scores (Holm-Bonferroni multiple comparisons test) revealed significant increases in the disease severity of the CD44- KO male and CD44-KO female animals compared to the WT male and WT female animals as well as a significant increase in disease score of CD44-KO male mice compared to CD44-KO female mice. No statistically significant differences were noted when between WT males and females.

c. Percent of survival data derived from WT and CD44-KO male and female cohorts. Log Rank (Mantel-Cox) revealed that all WT groups were significantly different compared to the CD44-KO groups. No statistically significant differences were found between the WT male and female cohorts nor between CD44-KO male and female cohorts, despite a modest reduction in percent survival of the CD44-KO male cohort. The data illustrated in figure 1 is representative of several pooled independent experiments totaling 226 mice.

Figure 2 a-g. CD44-KO mice exhibit lower numbers of T cell subsets, decreased transmigration of Th2 cells and decreased Th2 MMP-9 activity

a. CD44-KO mice express lower numbers of CD4+CD25+FoxP3+ (Treg), CD4+CXCR3+ (Th1), CD4+CCR3+ (Th2) and CD4+CCR7+ (TCM & TEM) cells compared to WT, expressed as averages of triplicate FACS analyses.

b. Transmigration of polyclonally activated WT and CD44-KO Th1 and Th2 cells through bare 3 μm pore membranes, expressed as averages of three independent assays using SDF-1 as chemoattractant. There were similar percent transmigrations, of WT and CD44-KO Th1 cells, while CD44-KO Th2 cells were observed to exhibit decreased% transmigration compared to WT Th2 cells.

c-e. Transmigrations of WT and CD44-KO Th1 and Th2 cells through (c) collagen type I-, (d) collagen type IV- and (e) fibronectin- coated 3μ pore membranes, expressed as averages of three independent assays using CCL19 and CCL21 as chemoattractants. The analysis revealed similar percent transmigrations when comparing WT and CD44-KO Th1 cells on all three coatings with CCL19 as a chemoattractant. In contrast, when using CCL19 as a chemoattractant, decreased CD44-KO Th2 cell migration was noted compared to WT Th2 cells. When CCL21 was used as the chemoattractant WT Th1 cell transmigration through collagen I coated membranes was decreased compared to CD44-KO Th1 cells. Additionally, on fibronectin-coated membranes CD44-KO Th2 cell transmigration was noted to be decreased compared to WT Th2 cells.

f & g. Representative zymographies illustrating decreased MMP-9 enzymatic activity in CD44-KO Th2 cell lysates compared to WT Th2 cell lysates (g), while no changes in MMP-9 enzymatic activity were noted in WT or CD44-KO Th1 cell lysates (f).

Figure 3 a1-d2. CD44 KO MOG-induced mice produce increased. Pro-inflammatory cytokines. CD44-KO mice produce increased amounts of pro-inflammatory and anti-inflammatory cytokines. "WT inj" and "KO inj" means injected with pertussis toxin (PT) only, but not with MOG; "WT inj MOG" and "KO inj-MOG" means injected with PT and MOG (the complete course)

a1 & 2 IL-6. By days 2 (a1) and 8 (a2), IL-6 levels are noted to be increased in both WT inj-MOG and KO inj-MOG mice compared to the PT only mice. Additionally, at day 8 (a2) the KO inj-MOG mice exhibit increased IL-6 compared to the WT inj- MOG- injected mice.

b1 & 2 IL-13. Similarly, by days 2 (b1) and 8 (b2) IL- 13 levels are noted to be increased in both WT inj-MOG and KO inj-MOG mice compared to the PT only mice. Additionally, at day 8 (b2) the KO-inj-MOG mice exhibit increased IL-13 compared to the WT inj-MOG mice.

c1 & 2 IL-23. The expression level of IL-23 by KO inj-MOG groups were higher than those observed in the WT inj-MOG groups at 2 (c1) and 8 (c2) days. Also, IL-23 levels were increased in KO inj-MOG compared to KO inj at days 2 and 8, but the WT inj- MOG was not significantly increased over the WT inj mice.

d1 & 2 IL-17. The expression level of IL-17 in the KO inj-MOG groups was higher than those observed in the WT inj-MOG groups at 2 (d1) and 8 (d2) days. Additionally, at 8 days, IL-17 levels were higher in the KO "inj" groups compared to the WT "inj" groups. Again, by days 2 and 8 IL- 17 levels are noted to be increased in both WT inj-MOG and KO inj-MOG mice compared to the PT only mice.

Figure 4 a-l. Peripheral lymphatic tissues from CD44-KO mice exhibit lower levels of CCR3, CCR7, CXCR3, Foxp3, and MMP-9.

Representative immunofluorescence micrographs of lymph nodes illustrating decreased CCR3 (a & b), CCR7 (c & d), CXCR3 (e & f), FoxP3 (g & h) and MMP-9 (I & j) in CD44-KO animals compared to WT animals. Representative DAPI stains (i & j). Scale Bar = 50μm.