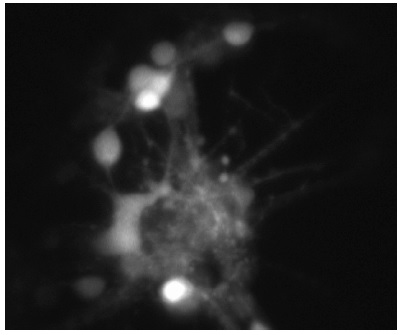
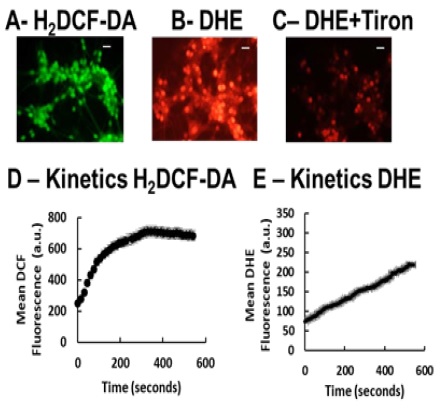
Figure 1 H2DCF-DA and DHE monitors ROS production upon incorporation to CGN. Representative fluorescence microscopy images of mature CGN showed that they accumulated a significant amount of DCF (Panel A) and oxidized DHE (PanelB) only after 10 min of addition of 10 µM H2DCF-DA and DHE to MLocke's K25. Addition of 20 mM Tiron to the extracellular medium 1 hour before the addition of DHE largely attenuated the increase of DHE fluorescence (Panel C). The kinetics of an increase of the average fluorescence intensity per pixel in the soma of mature CGN after the addition of H2DCF-DA and DHE to MLocke's K25 medium is shown in Panels D and E, respectively. Scale bar inserted in fluorescence microscopy images = 10 µm.

Figure 2 Figure 2. The production of ROS detected by H2DCF-DA and DHE in mature CGN is more than 90% inhibited by MβCD. Panel A: Representative fluorescence microscopy images show that treatment of CGN with 0.5-1 mM MβCD during 5 min almost completely blocks the increase of fluorescence associated with the production of ROS detected by H2DCF-DA or DHE addition to the medium. Bright-field (BF), green fluorescence (GF) and red fluorescence (RF) images are shown for each one of the selected fields. Panel B: Dependence of the rate of ROS production upon MβCD concentration by 5 min treatment of CGN with MβCD. The rate of ROS production (means± s.e.) has been determined from the maximum slope of the kinetics of an increase of the average fluorescence intensity per pixel in CGN somas of DCF (solid triangles) or of oxidized DHE (solid circles). Panel C: The increase of fluorescence intensity per pixel in CGN somas of DCF after 5 min, mean ± s.e., was approximately 60% of the increase recorded for controls when CGN were preincubated with 0.5 mM cholesterol-MβCD complexes instead of only MβCD. Phase-contrast or bright field (BF) and green fluorescence (GF) images are shown for a representative selected field. Scale bar inserted in fluorescence microscopy images = 10 µm.

Figure 3 Figure 3. The production of ROS detected by H2DCF-DA and DHE in mature CGN is almost completely inhibited by SOD and DPI, but it is only partially inhibited by DNP or FCCP. Panel A:10 min preincubation with 1 mM DNP or 5 µM FCCP inhibits ≤40% of ROS production detected by H2DCF-DA or DHE in CGN between 8 and 10 DIV, while it is almost completely inhibited by addition of 500 U/mL SOD only 5 min before of H2DCF-DA or DHE addition. Bright-field (BF), green fluorescence (GF) and red fluorescence (RF) images are shown for each one of the selected fields. Scale bar inserted in fluorescence microscopy images =10µm. Panel B: Percentage of inhibition of ROS production by 1 mM DNP, 5 µM FCCP and 500 U/mL SOD relative to controls, calculated from the increase of the average±s.e. fluorescence intensity per pixel in CGN somas 5 min after addition of H2DCF-DA or DHE to MLocke's K25 medium. Panel C: The inhibition of ROS production after 5 min preincubation with 10 µM DPI relative to controls is also shown by the large attenuation produced by DPI on the increase of the average fluorescence intensity per pixel in CGN somas 5 min after addition of H2DCF-DA to MLocke's K25 medium.

Figure 4 Figure 4. Staining of CGN with cholera toxin B-Alexa 488 monitors lipid rafts increase during CGN maturation in vitro. Panel A: Dependence upon DIV of the decrease of the ratio (340/380) of the fluorescence of Fura2-loaded CGN after the addition of 10 µM of the LTCCs blocker nifedipine. See Materials and Methods for experimental details of CGN loading with Fura2-AM, image acquisition and ratio (340/360) calculations. Panel B: Representative fluorescence microscopy images of non-mature (5 DIV) and mature CGN (10 DIV) stained by 1-hour incubation at 37ºC and 5% CO2 with 1 µg cholera toxin B-Alexa 488, and washed with 1 mL MLocke's K25 medium immediately before images acquisition. Bright-field (BF) and green fluorescence (GF) images are shown for each one of the selected fields. Scale bar inserted in fluorescence microscopy images = 10 µm. Panel C: Quantitative fluorimetric analysis of cholera toxin B-Alexa 488 bound to CGN resuspended as indicated in the Materials and Methods. The results yielded a nearly two-fold increase, 1.8±0.2 (mean of triplicate experiment ± s.e.), of the fluorescence of CGN-bound cholera toxin B-Alexa 488 from 5 to 10DIV.

Figure 5 Figure 5. Increase of CGN lipid rafts markers H-Ras and caveolin-1 and of nNOS during CGN maturation in vitro. Western blotting of H-Ras (Panel A) and caveolin-1 (Panel B) in CGN lysates as a function of days in vitro (DIV). Panel C: Western blotting of nNOS in CGN lysates at 5 and 9 DIV. The images shown in Panels A, B and C are representative of the results obtained with three different CGN preparations. The results have been plotted in Panels A, B and C as the averages ± s.e. of the ratio of intensities (H-Ras/β-actin), (caveolin-1/β-actin) and (nNOS/β-actin), respectively, versus days in vitro.

Figure 6 Figure 6. Extensive FRET in CGN from caveolin-1 tagged with IgG-Alexa488 (as FRET donor) to H-Ras tagged with IgG-Cy3 (as FRET acceptor). Panel A: Representative quantitative fluorescence microscopy images of CGN stained with anti-caveolin-1 (sc-894)/IgG-Alexa488 (cav1*A488), with anti-caveolin-1/IgG- Alexa488 and anti-H-Ras (sc-32026)/IgG-Cy3 (cav1*A488/H-Ras*Cy3) and only with anti-H-Ras/IgG-Cy3 (H-Ras*Cy3). Bright-field (BF), green fluorescence (GF) and red fluorescence (RF) images are shown for each one of the selected fields. Green and red frames display the donor and acceptor fluorescence, respectively. Scale bar inserted in fluorescence microscopy images = 10 µm. Panel B: Ratio of Red/Green fluorescence intensity per pixel (RF/GF) obtained from the analysis of fluorescence intensity data of CGN somas stained with anti-caveolin-1/IgG-Alexa488 only (cav1*A488) and double stained with anti-caveolin-1/IgG-Alexa488//anti-H-Ras/IgG-Cy3 (cav1*A488/H-Ras*Cy3). The results shown in this panel B are the mean ± s.e. (*) p< 0.05, i.e. statistically significant with respect to the control (CGN labeled with the Alexa488 FRET donor only).

Figure 7 Figure 7. Extensive FRET in CGN from nNOS tagged with IgG-Alexa488 (as FRET donor) to H-Ras tagged with IgG-Cy3 (as FRET acceptor). Panel A: Representative quantitative fluorescence microscopy images of CGN stained with anti-nNOS (sc-5302)/IgG-Alexa488 (nNOS*A488), with anti-nNOS/IgG-Alexa488 and anti-H-Ras (sc-32026)/IgG-Cy3 (nNOS*A488/H-Ras*Cy3) and only with anti-H- Ras/IgG-Cy3 (H-Ras*Cy3). Bright-field (BF), green fluorescence (GF) and red fluorescence (RF) images are shown for each one of the selected fields. Green and red frames display the donor and acceptor fluorescence, respectively. Scale bar inserted in fluorescence microscopy images = 10 µm. Panel B: Ratio of Red/Green fluorescence intensity per pixel (RF/GF) obtained from the analysis of fluorescence intensity data of CGN somas stained with anti-nNOS/IgG-Alexa488 only (nNOS*A488) and double-stained with anti-nNOS/IgG-Alexa488//anti-H-Ras/IgG-Cy3 (nNOS*A488/H-Ras*Cy3). The results shown in this panel B are the mean ± s.e. (*) p< 0.05, i.e. statistically significant with respect to the control (CGN labeled with the Alexa488 FRET donor only).

Figure 8 Figure 8. CGN maturation in vitro elicits an attenuation of the production of ROS detected by H2DCF-DA that is impaired by Cb5R3 silencing. Panel A: CGN production of ROS detected by H2DCF-DA decay more than 50% from 5 to 9 DIV, and either at 5 and 9 DIV is more than 90% inhibited by 5 min preincubation with 5 mM MβCD. Panel B: Treatment of CGN at 4 DIV with si- Cb5R3 RNA during 90 hours (si-Cb5R3) resulted in ~50% and ~60% decrease of Cb5R3 expression with respect to CGN treated with si-Control RNA (si-CTRL) or with respect to untreated CGN (CGN-CTRL), respectively. The images shown in this panel are representative of the results obtained with three different CGN preparations. The results have been plotted as the averages ± s.e. of the ratio of intensities (Cb5R3/β-actin). Panel C: CGN production of ROS detected by H2DCF-DA increases between 3.5 and 4-fold in CGN treated with si-Cb5R3 RNA (si-Cb5R3) with respect to untreated CGN (CGN-CTRL) and with respect to CGN treated with si-Control RNA (si-CTRL). (*) p< 0.05, i.e. statistically significant with respect to CGN-CTRL or si-CTRL. The difference between si-CTRL and CGN-CTRL is not statistically significant. The results shown in panels A, B and C are the means± s.e. of experiments performed by triplicate.

Figure 9 Figure 9. The production of ROS/RNS detected by DAF2-DA in mature CGN is largely inhibited by MβCD, DPI and MnTBAP. Panel A: Representative fluorescence microscopy images of CGN (8-9 DIV) showing that treatment of CGN with MβCD during 5 min almost completely blocks the increase of fluorescence associated with the production of ROS/RNS detected by DAF2-DA at 1200 s after addition of 5 µM DAF2-DA. Bright-field (BF) and green fluorescence (GF) images are shown for each one of the selected fields. Scale bar inserted in fluorescence microscopy images = 10 µm. Panel B: Dependence of the maximum increase of the DAF2 fluorescence intensity per pixel in CGN somas (peak DAF2 fluorescence) upon treatment of CGN during 5 min with the indicated MβCD concentrations. Y-axis values have been expressed as percent relative to control (0 MβCD). Panel C: Kinetics of the increase of the average DAF2 fluorescence intensity per pixel in CGN somas of CGN at 8-9 DIV in the absence (control, filled circles) and in the presence of 5 µM (filled squares) and 10 µM DPI (filled triangles). Panel D: Dependence upon DPI concentration of the peak DAF2 fluorescence intensity per pixel in CGN somas. Panel E: Dependence of the peak DAF2 fluorescence intensity per pixel in CGN somas upon treatment of CGN during 5 min with the indicated MnTBAP concentrations. Y-axis values have been expressed as percent relative to control (0 MnTBAP). The results shown in panels B, C, D and E are the means± s.e. of experiments performed by triplicate.

Figure s1 Supplementary Figure S1. Western blotting of CGN lysates with the primary antibodies used in this work. The detection and specificity of primary antibodies for their corresponding target proteins in CGN lysates was confirmed by Western blotting: rabbit anti-caveolin-1 (sc-894), goat anti-H-Ras (sc-32026), mouse anti- nNOS (sc-5302) and rabbit anti-Cb5R3 (ProteinTech-10894-1-AP). SDS-PAGE were loaded with 20 µg of protein of CGN lysates per lane. All primary antibodies have been used at a dilution of 1:100 in TBST. Secondary antibodies, anti-rabbit IgG-Horseradish peroxidase, anti-goat IgG-Horseradish peroxidase and anti-mouse IgG- Horseradish peroxidase, were used at a dilution of 1:25,000, 1:10,000 and 1:5,000 in TBST, respectively. See Materials and Methods for further experimental details.

Figure s2 Supplementary Figure S2. Video of flash-like increase of DAF2-loaded CGN. Representative video of flash-like increase of the fluorescence intensity of DAF2- loaded CGN upon irradiation with 470 nm pulses of 0.05 s at intervals of 5 s. CGN at 8-9 DIV in Petri plates were kept at 37ºC in MLocke's K25 in the thermostated plate holder of the epifluorescence microscope for image acquisition. Starting within 15-30 s after addition of 5 µM DAF2- DA images were acquired and later mounted as the video enclosed herein.

Figure s3 Supplementary Figure S3. Downregulation of CYP46 expression during CGN maturation in vitro. Panel A: Western blotting showing the specific immunodetection of CYP46 in CGN lysates (4 DIV) with goat anti-CYP46 (Santa Cruz Biotechnology sc-74391, 1:100 dilution). Panel B: Immunodetection of CYP46 in CGN lysates as a function of days in vitro (DIV). After immunodetection of CYP46 with goat anti-CYP46 (Santa Cruz Biotechnology sc-74391, 1:100 dilution), the PVDF membrane was washed and stripped as indicated in the Materials and Methods and used for immunodetection of β-actin with monoclonal mouse anti-β-actin (Sigma- Aldrich A1978, 1:200 dilution). The images shown are representative of the results obtained with three different CGN preparations. The results have been plotted in Panel C as the means ±s.e. of the ratio of intensities (CYP46/β-actin) versus days in vitro.

Figure s4 Supplementary Figure S4. The flash-like increase of DAF2-loaded CGN is not altered by tetrodotoxin, nifedipine or MK801. The increase of fluorescence of mature CGN (9-10 DIV) loaded with DAF2-DA at 1200 s after addition of 5 µM DAF2- DA was not significantly altered with respect to control (CTRL) in the presence of 1 and 2 µM tetrodotoxin (TTX) nor in the presence of 10 µM nifedipine (Nif) or 10 µM MK801. The results shown are means ±s.e. of triplicate experiments.