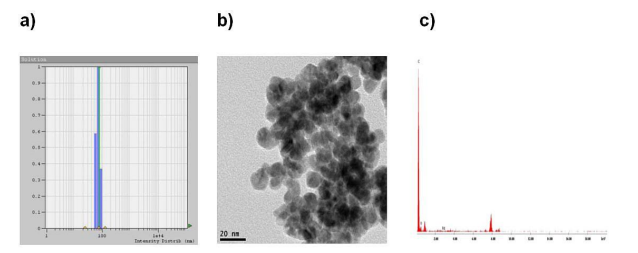
Figure 1: (sample 229-SG-6) a) DLS data of PEG20K-Pd Nanoparticles b) TEM image shows that 13-14 nm sized PEG20K-Pd Nanoparticles. c) EDX Data of Synthesized PEG20K-Pd Nanoparticles
Figure 1: (sample 229-SG-6) a) DLS data of PEG20K-Pd Nanoparticles b) TEM image shows that 13-14 nm sized PEG20K-Pd Nanoparticles. c) EDX Data of Synthesized PEG20K-Pd Nanoparticles
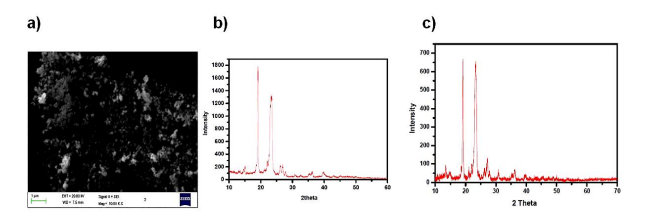
Figure 2: (Sample 229-SG-6): a) SEM Micrograph of PEG20K-PdNanoparticles b) XRD pattern of the synthesized PEG20K-Pd nanoparticles c) XRD pattern of PEG20K polymer
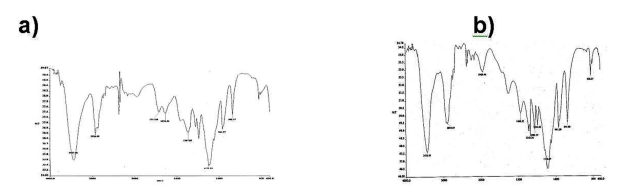
Figure 3: (Sample 229-SG-6): The FT-IR spectra of PEG20K-Pd nanoparticles. b) The FT-IR spectra of pure polymer PEG20K
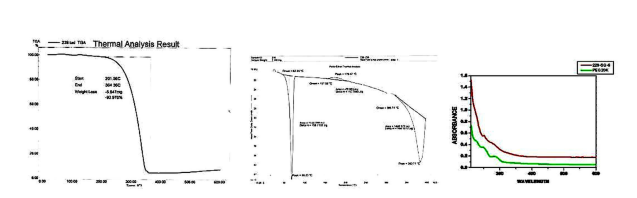
Figure 4: : (Sample 229-SG-6):a) TGA curve for PEG20K-Pd nanoparticles. b) Differential Scanning Calorimetry of PEG20K-Pd nanoparticles.c) UV spectra of PEG20K-Pd nanoparticles
Tables at a glance
Figures at a glance