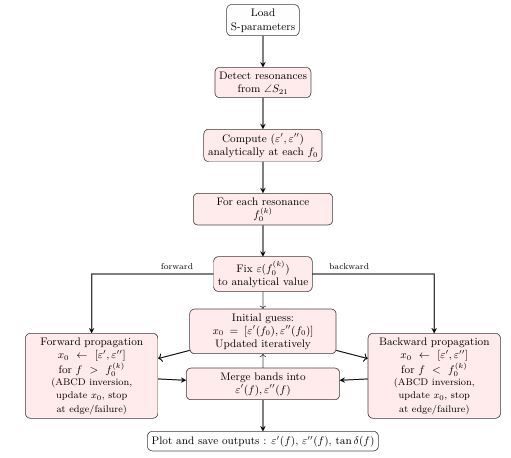
Figure 1: Flowchart of the multi-resonance anchored permittivity extraction algorithm.
Figure 1: Flowchart of the multi-resonance anchored permittivity extraction algorithm.
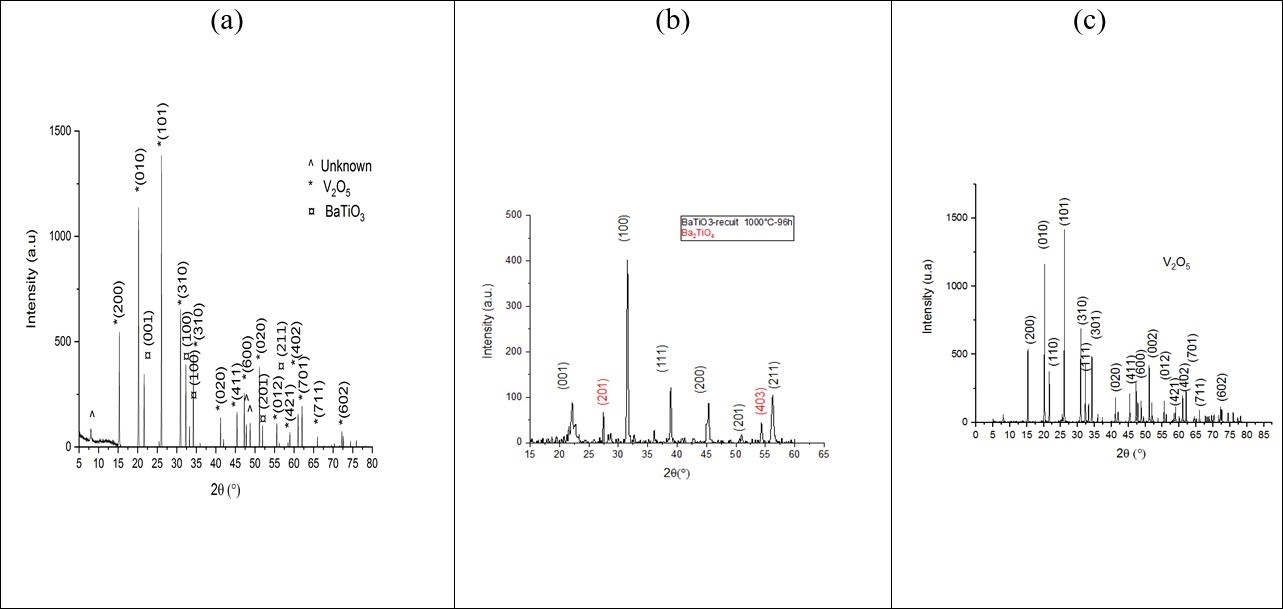
Figure 2: XRD comparison of composite (a) BaTiO3V2O5 with (b) BaTiO3 and (c) V2O5.
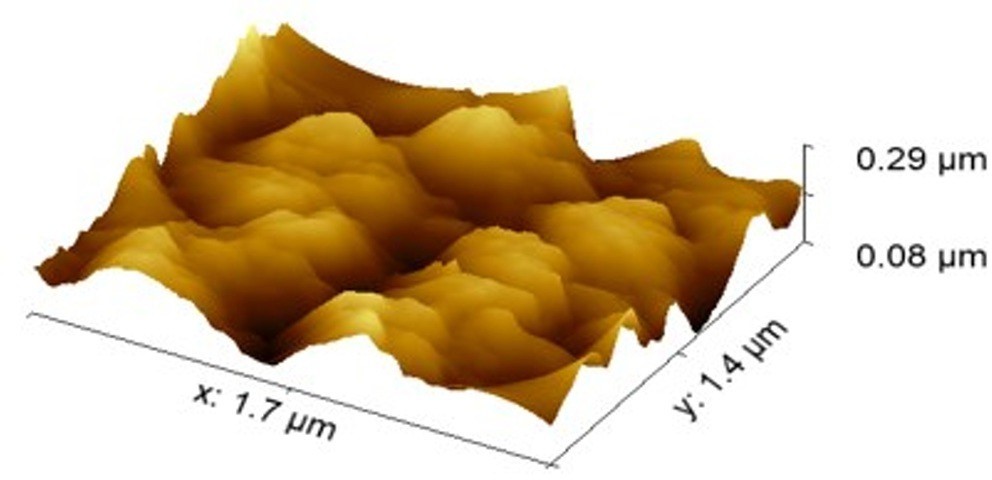
Figure 3: Two-dimensional AFM image (1.7 µm × 1.4 µm) of the BaTiO3/V2O5 composite.
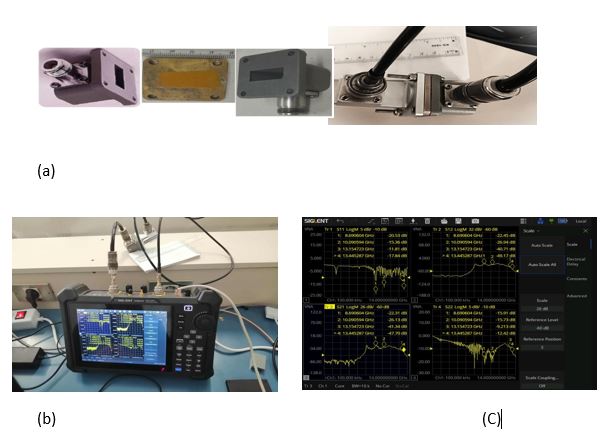
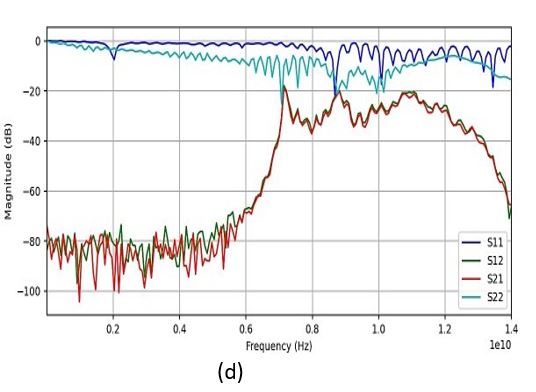
Figure 4: Experimentation and S matrix measurement : (a) composite filling (b) measurement on VNA- SHN914A (c): S viewing (d) 4 complex Sij
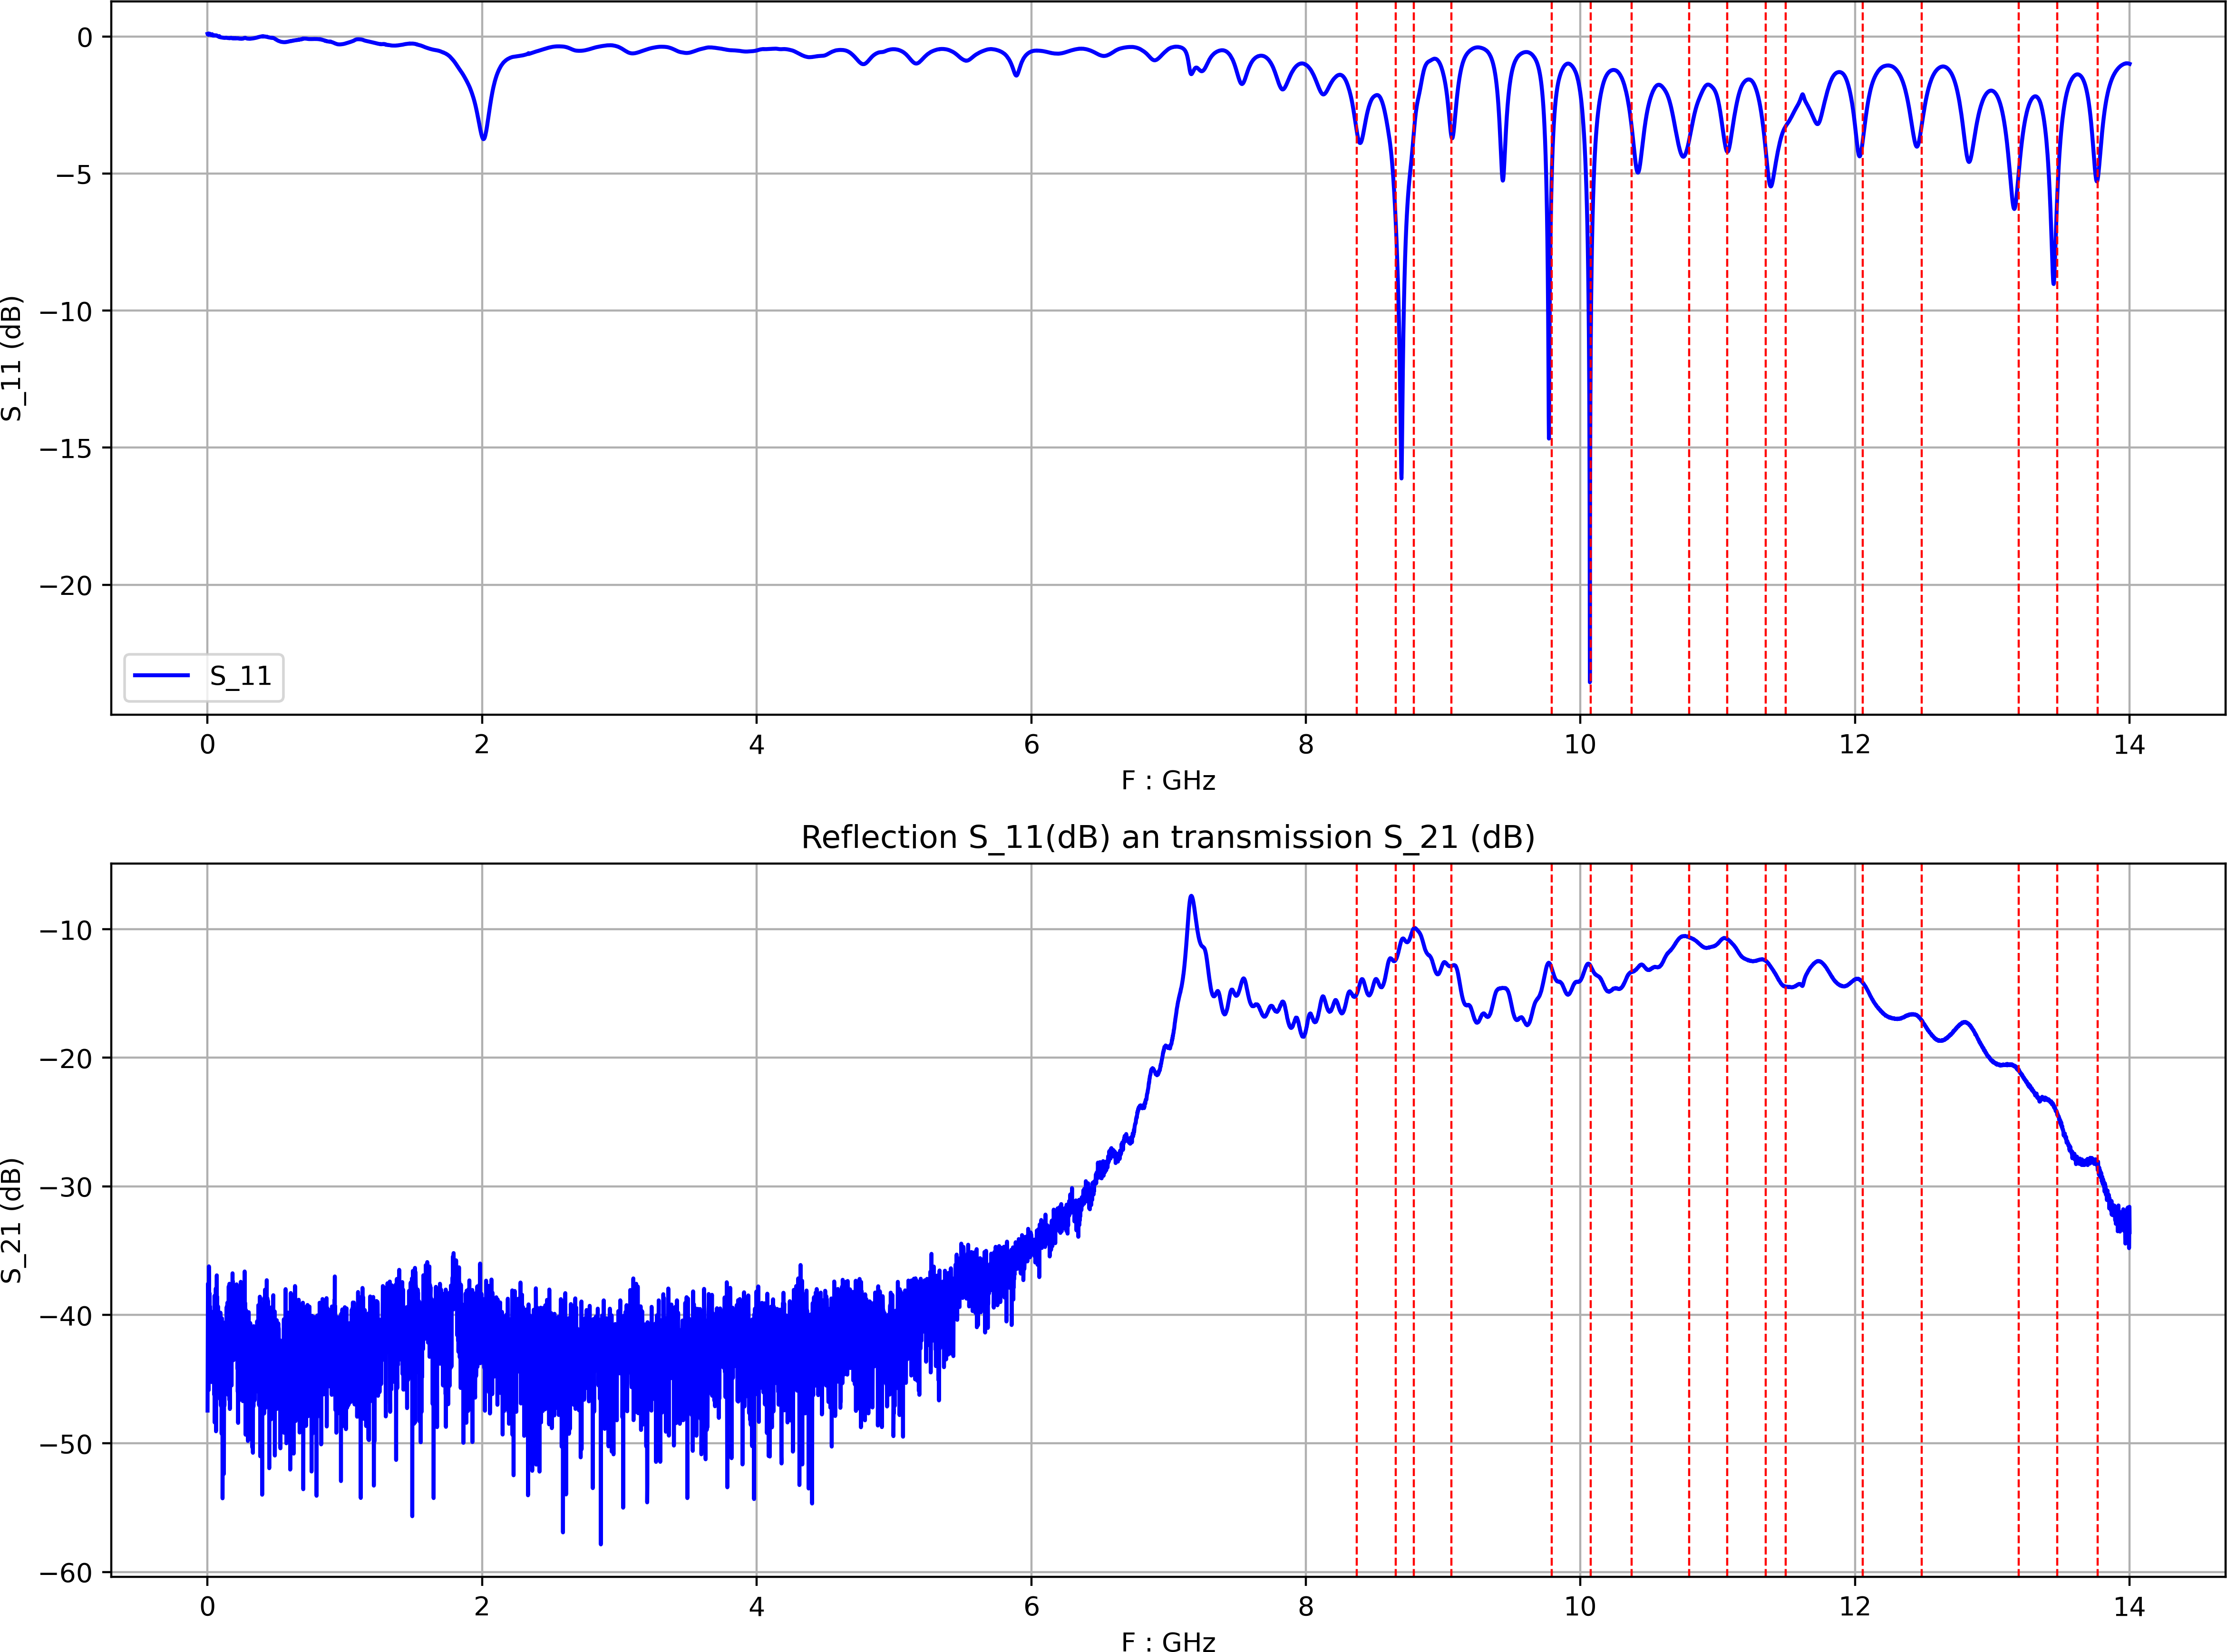
Figure 5: Reflection S11 and transmission S21 in dB. Red dashed lines mark the 16 detected resonances.
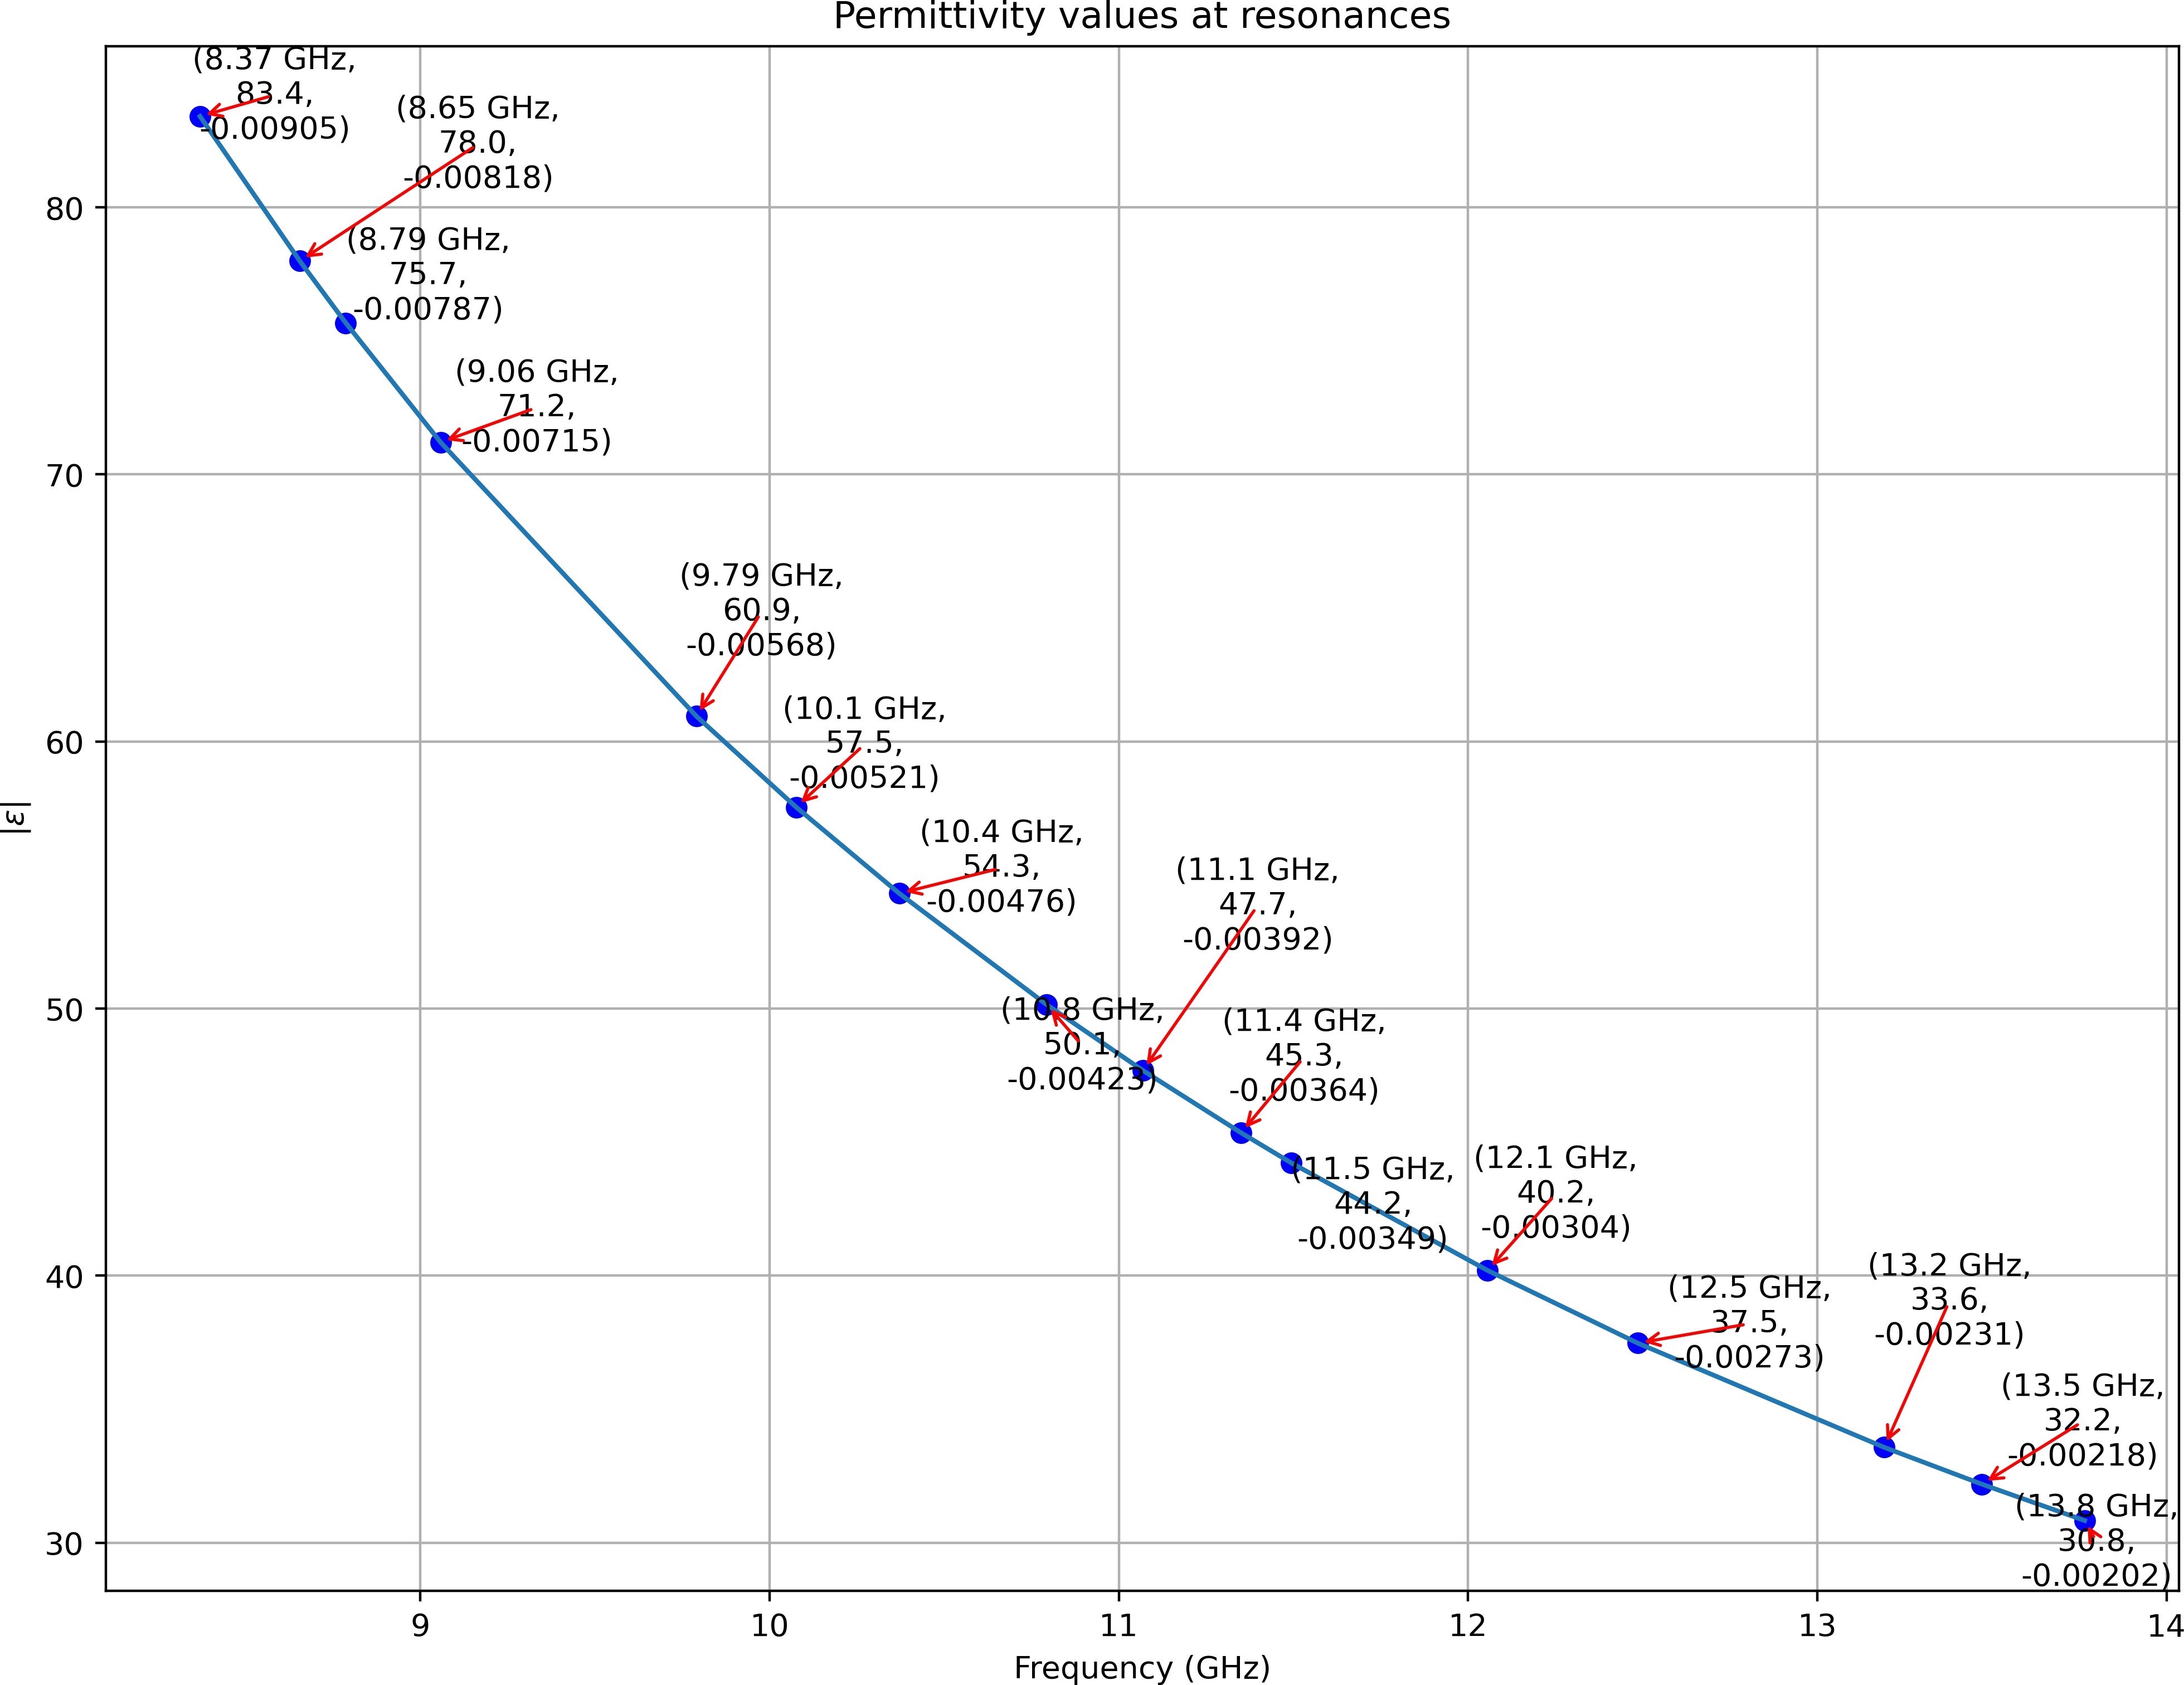
Figure 6: Permittivity magnitude at 16 resonances.
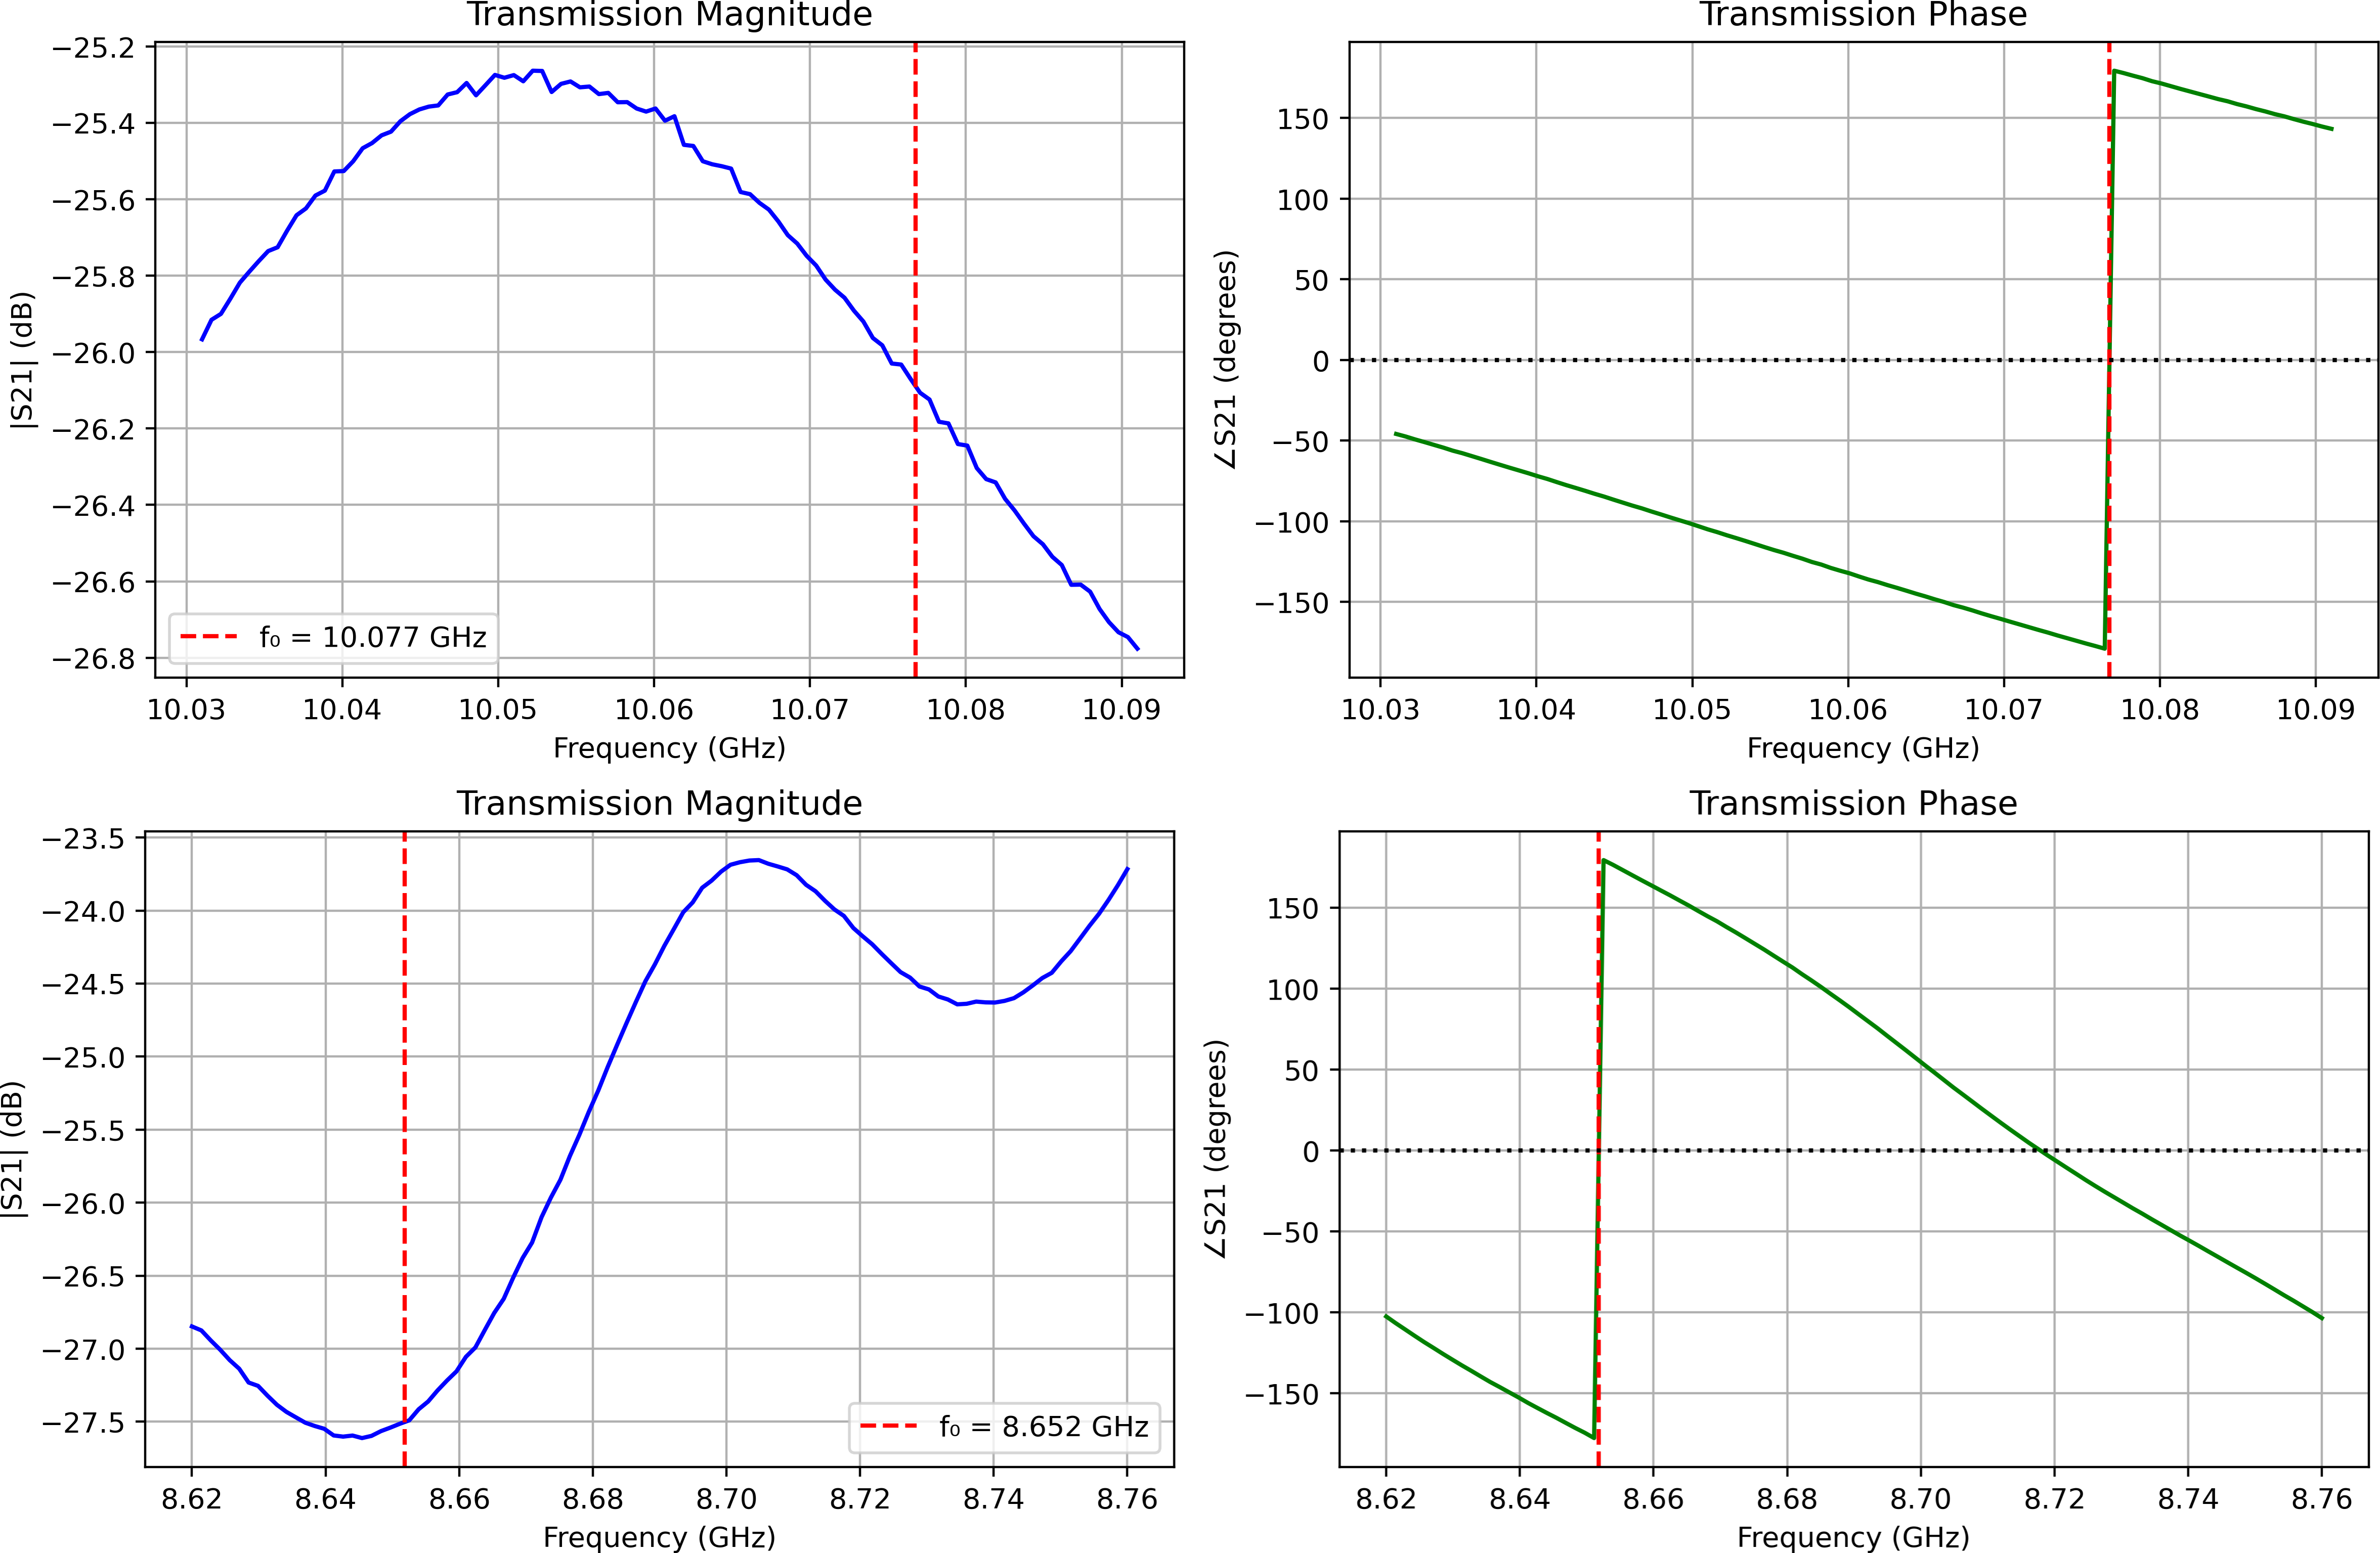
Figure 7: Permittivity profile around 8.65 and 10.07 GHz resonances.
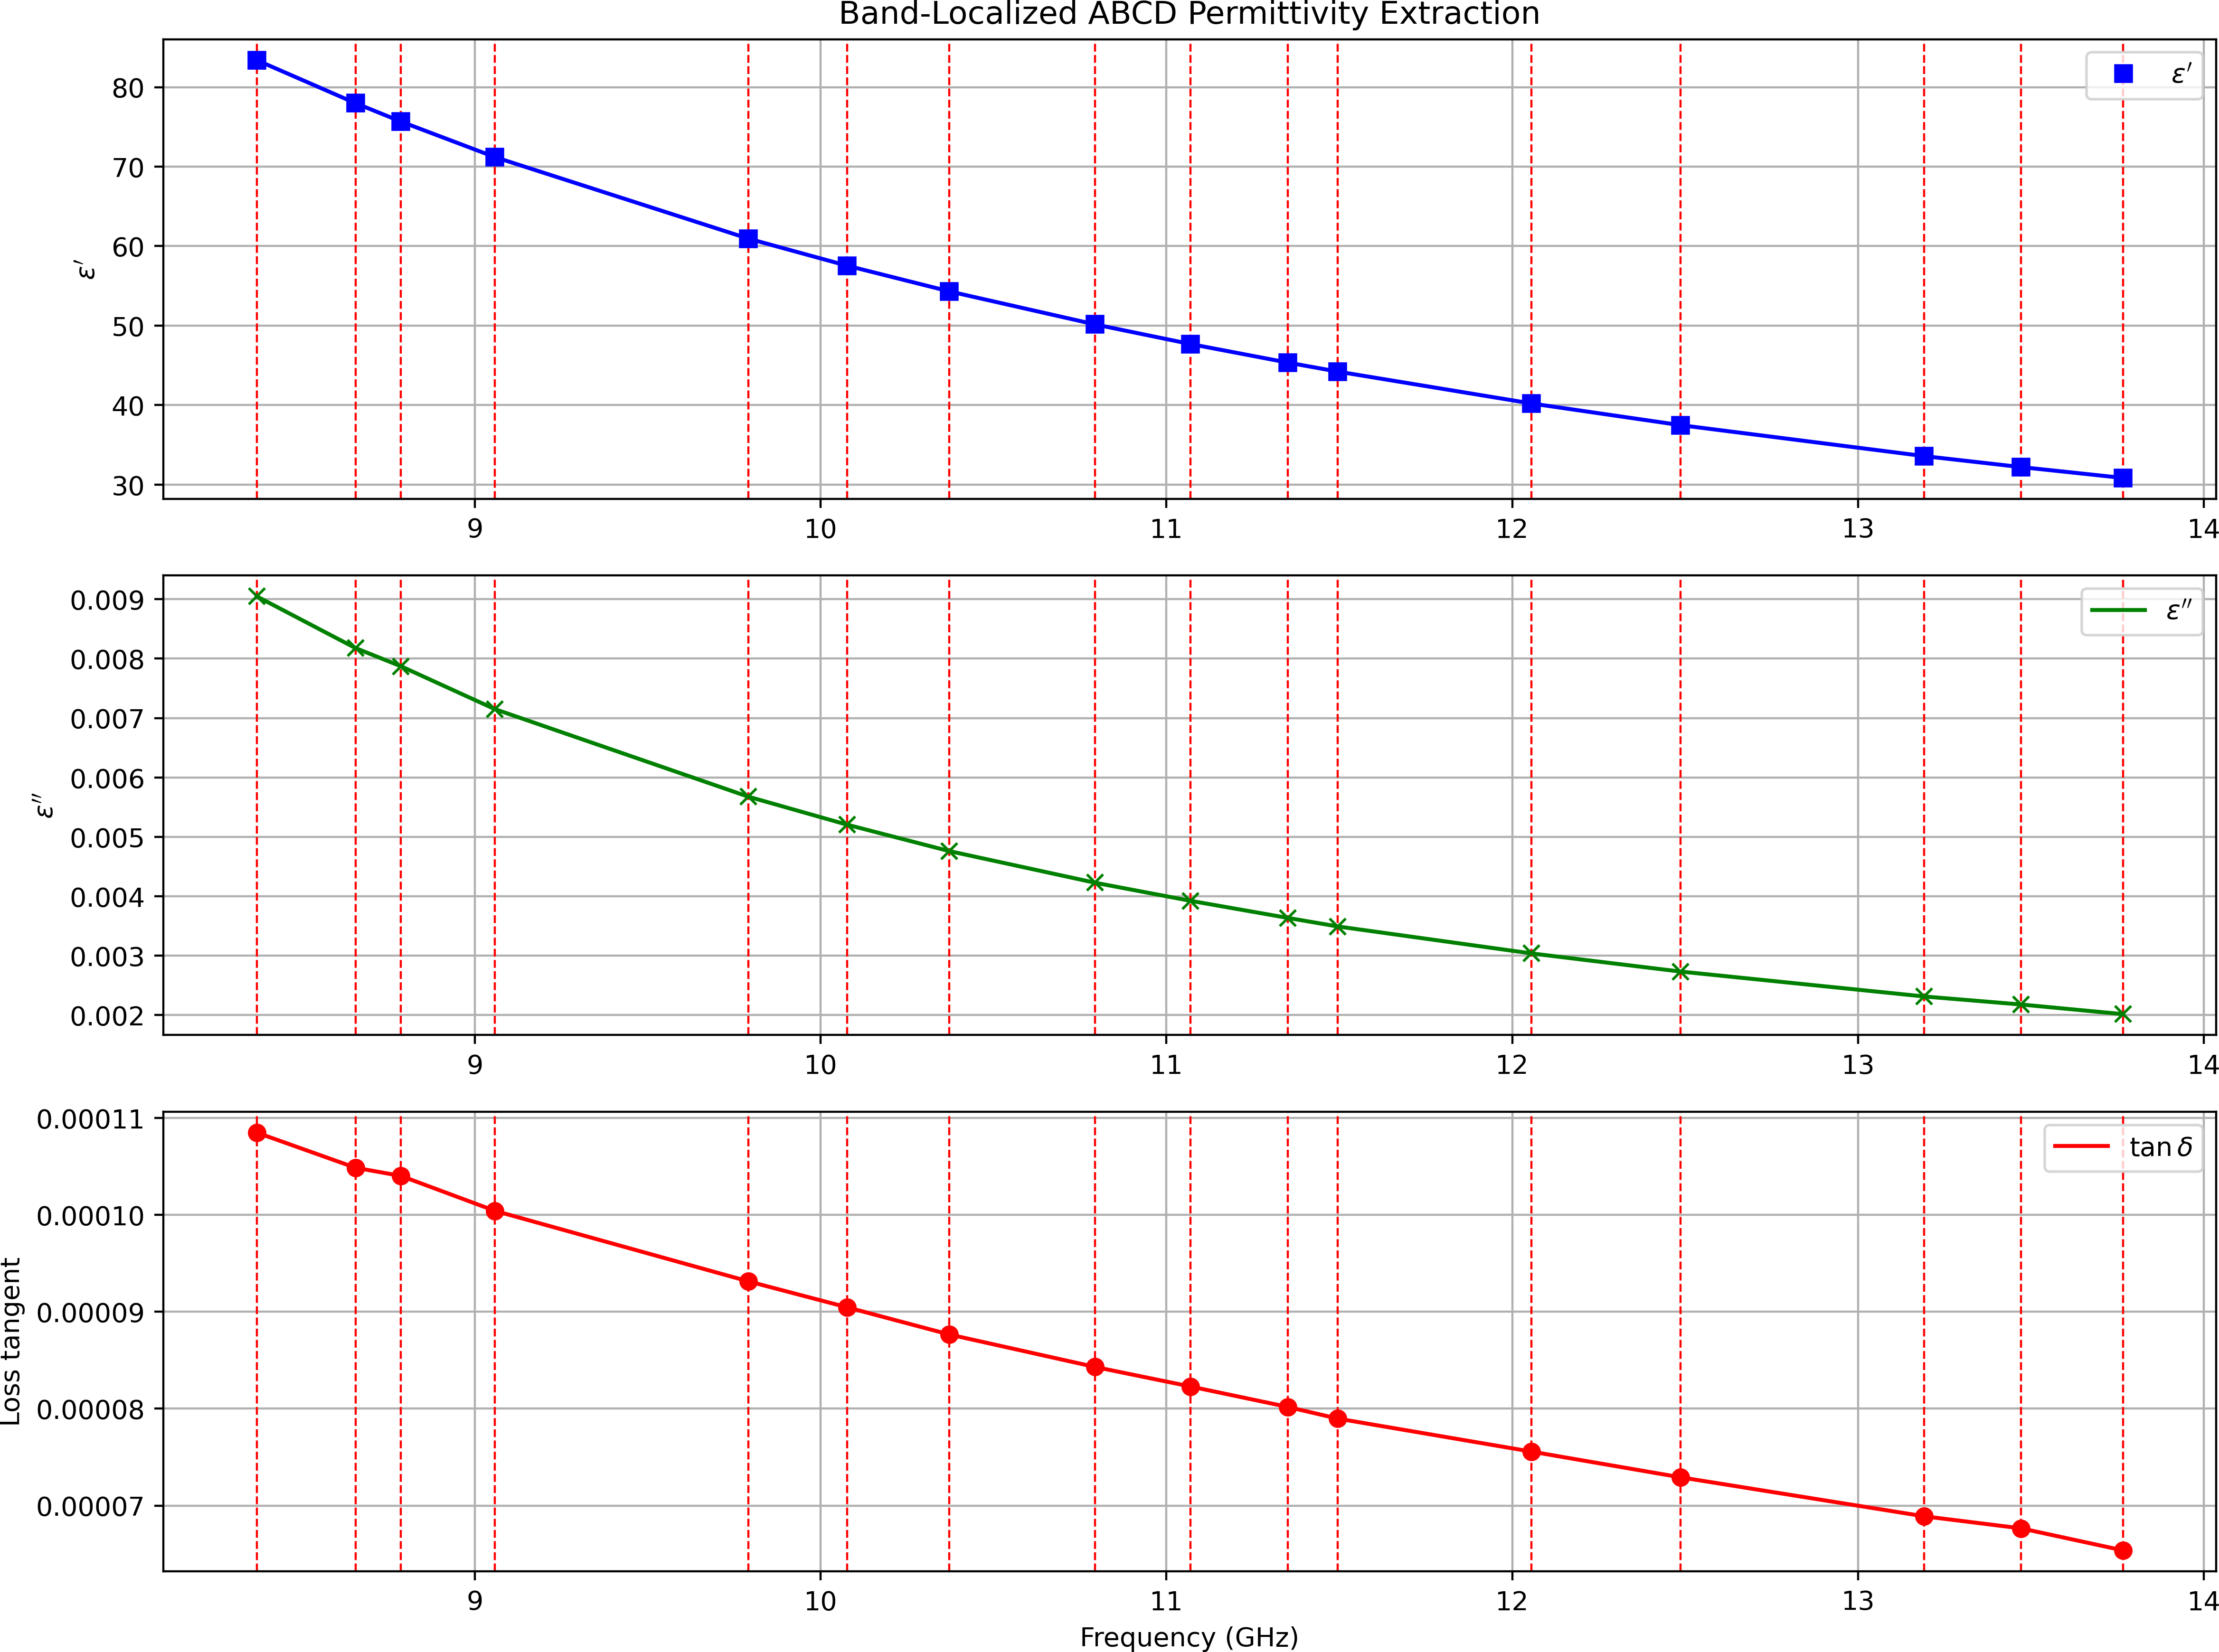
Figure 8: Full-band complex permittivity of FE − BTV over 8.00 GHz to 14.0 GHz.
Tables at a glance
Figures at a glance