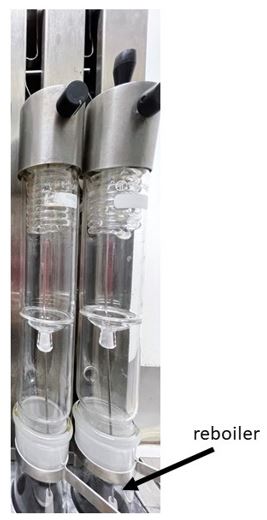
Figure 1: Photograph of Reboiler
Figure 1: Photograph of Reboiler
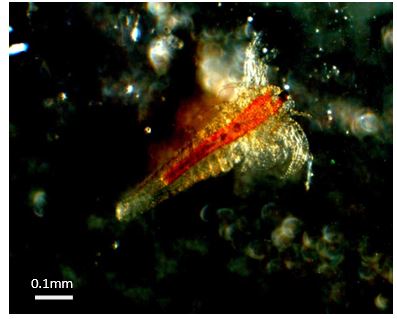
Figure 2: Photograph of Artemia salina used for Toxicity Tests
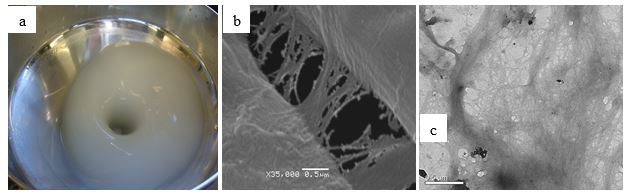
Figure 3: Photographs of Nanofibrils of Peach Palm: (a) - suspension gel; (b) - SEM Photograph; (c) - TEM micrograph
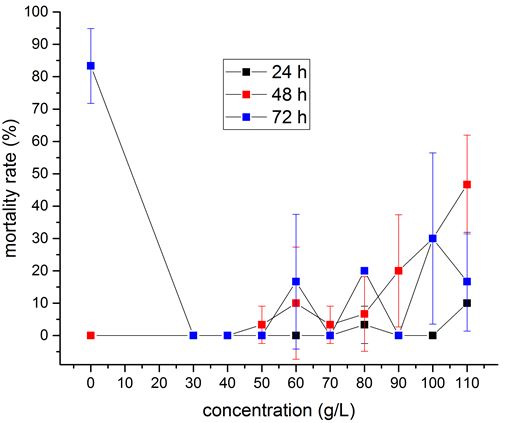
Figure 4: Plots of Artemia salina mortality (in %) Vs. Concentrations of gel with nanofibrils in the saline solution showing toxicity of nanofibrils after 24, 48 and 72 h. The continuous lines are just for guidance. The standard deviations are shown for each measurement
Tables at a glance
Figures at a glance