Parametric Optimization of Fused Deposition Modeling Using Multi-Objective Techniques
Received Date: Feburary 09, 2022 Accepted Date: March 09, 2022 Published Date: March 11, 2022
doi: 10.17303/jnsm.2022.7.105
Citation: PVS Subhashini (2022) Parametric Optimization of Fused Deposition Modeling Using Multi-Objective Techniques. J Nanotech Smart Mater 6: 1-15
Abstract
The Fused Deposition Modeling is one of the additive manufacturing used for the prototyping, production, modeling. This is one of the easy, flexible and economical methods for materials like ABS, PLA, PC, Rubber, and Linen. In this work optimization has been carried out for surface roughness, the length of workpiece using fused deposition modeling with different parameters using the Taguchi Method. A rectangular workpiece is produced using FDM. The process parameters were chosen as fill density, shell thickness, layer height, and speed. An orthogonal array L27 was performed to perform the experiments. Work piece (ABS) surface roughness is calculated using the metrological device called Talysurf. Multiple Regression analysis is performed to examine the out-turn of process parameters on Surface roughness, length of the workpiece. Then using the equations obtained from multiple regression analysis, Multi-Objective optimization to be carried out using Genetic, Goal programming.
Keywords: Fused Deposition Modeling; Taguchi Method; Regression Analysis; Surface Roughness; Multi-Objective; Genetic; Goal Programming
List of abbreviations: GA: Genetic Algorithm; MATLAB: Matrix Laboratory; GP: Goal Programming; DOE: Design of Experiments SR: Surface Roughness; RPM:Revolution per Minute; mm: Millimeter mm/sec: Millimeter per Second; μm: Microns: X1: Fill density(mm/sec): X2: Shell thickness(mm): X3: Layer height(mm): X4: Speed(mm/sec): Ra: Surface Roughness: DOE: Design of Experiments
Introduction
3D printing technology was introduced in 1980’s by Scott Crump, chairman, and co-founder of Stratasys Ltd. This is one of the companies producing a large volume of 3D printers. The linear programming technique is a tool for the management decisions. The difficulty with the linear programming is that the objective function measured in only one dimension such as profit or loss or production capacity. It is impossible to measure the multiple objectives until or unless they are in the same units. Goal Programming developed by Charnes and Cooper gives a technique for solving such multi-objective models. The idea is to convert the multiple objectives into a single goal. Goal programming is an optimization technique used for analysis to find out necessary resources to get an expected set of objectives, to calculate the amount of achievement of goals with the required or available resources, providing the optimized solution under a varying degree of necessary resources and its priorities of the goals.
Rao et al., [1] presented dimensional accuracy, cost of production, product quality, and build time, energy consumed to the mechanical and tribological parameters of models. Here the multi-objective technique is used. The optimization technique used is a teaching-learning- based optimization algorithm and non-dominated sorting (NSTLBO) TLBO algorithm.
Anoop K Sood et al., [2] studied the effectiveness of process parameters like part build orientation, layer thickness, raster width, air gap, raster angle on the compression stress of sample. Presented mathematically validated predictive equation and the compressive stress on the process parameters. Quantum-behaved particle swarm optimization (QPSO) is used to know optimal parameter setting.
Sandeep Raut et al., [3] studied the effectiveness of the process parameter like build-up orientation and the total cost of the FDM parts. Here ABS is used as a material, CATALYST is the software, and Stratasys FDM is the machine. As per ASTM standards, the flexural, tensile samples prepared with the various build-up orientation in three-dimensional axes. The built orientation is a similar to the effect of tensile and flexural with total cost on processed parts. At minimum manufacturing cost, the FDM parts manufactured with high mechanical properties.
Alhubail et al., [4] evaluated the influence of the process parameters like an air gap, contour width, layer thickness, raster orientation, raster width and the quality of tensile strength and surface roughness. Produced FDM parts had weak tensile strength and surface error. The Composite ABS-M30i material is used to work on build parts. The Mathematical process like Signal to Noise ratio (S\N), Analysis of Variance (ANOVA), regression analysis is used to find the process parameters. Surface roughness and Tensile strength are mostly affected by an air gap. SEM is used to analyze the results.
Venkatasubba Reddy et al. [5], studied the fused deposition modeling on the ABS material of layer by layer process is done. The process parameters like an air gap, raster angle, raster width, layer thickness affect the surface roughness. The novel ABS-M30 has used build parts. Taguchi technique is preferred to modify the process parameters with length, width diameter, and surface finish. This method provides excellent dimensional accuracy and surface finish.
Pavan Kumar Gurrala et al., [6] considered the part accuracy of fused deposition modeling. Volumetric change and inaccuracy of the ABS material are known. Design of experiments is done to determine out the minimum number of operations. The models are done by taking effect of curl volumetric is found. The Parametric equation used for modeling of multi-objective optimization.
R.H. Philipson et al., [7] presented the application of goal programming to the single point turning operation with the objective to minimize cost.
Nurullah Umarusman et al., [8] suggested, De Novo Programming model which includes De Novo Programming and Min-max Goal Programming approaches and uses positive and negative ideas.
Fahraz Ali et al., [9] described work on the FDM for optimizing the parameters like slice height, raster angle ,raster width
number of contours, STL angle, STL deviation, air gap. Surface roughness, material consumption, build time are the decision variables.
Zulkarnain Abdul Latiff et al.[10], evaluated the process to decide the optimal post process parameters to get best outcome for hardness, compressive parts and good tensile strength.
Materials and Methods
Material used
Here Fused Deposition Modelling technique is used for producing rectangular components. Material used here is ABS (Acrylonitrile butadiene styrene and its chemical formula (C8H8)x·(C4H6)y·(C3H3N)z which is very commonly used thermoplastic polymer. glass transition temperature of ABS is nearly (105 °C) 221 °F.
Selection of orthogonal array
Figure 1 shows the 3D printing system (Fused Deposition Modelling) which is an available resource to do experiments. For this FDM the available or measurable parameters are fill density, shell thickness, layer height, and speed. Therefore these parameters are considered as process parameters for the Taguchi technique.
Selection of number of experiments are calculated based on the number of process parameters (factors) , levels of process parameters (factors) and orthogonal array was selected using Taguchi technique. L27 Orthogonal Array was selected.
Considered process parameters = 4
Considered levels for process parameters = 3
Required experiments to be conducted = 27
Experimental Procedure
Based on the Design of Experiments 27 workpieces were made which are shown in Figure 2. Table 1 presents the DOE along with length (the amount of wire consumed for making one workpiece) and surface roughness which is measured using the Talysurf instrument.
Regression analysis
A regression analysis has been carried out for variables of experimental data and for the outputs i.e. surface roughness and length using Microsoft Excel.
Surface roughness. is one of the objective functions considered and the optimization is to minimize. The regression equation calculated is shown in Figure 3.
Length. is one more objective function considered and its optimization is to minimize. The regression equation calculated is shown in Figure 4.
Table 2 shows the experimental results and excels results of the workpiece when the fabrication is done. The result gives the length, surface roughness.
Multi-Objective Optimization (Genetic and Goal Programming). Regression equation is calculated for the Length and Surface roughness and validated. Then Multi-Objective optimization is carried out for minimizing the length and surface roughness. The techniques used for optimization is Goal Programming and Genetic algorithm. Objective function and their constraints are presented below.
Minimize (LENGTH)=2.6525 + (0.0065*X1) + (0.078056*X2) + (0.75*X3) + (0.001306*X4)
Subjected to constraints 20m/sec ≤ X1 ≤ 40m/sec
3 mm ≤ X2 ≤ 7 mm
0.06 m ≤ X3 ≤ 0.2 m 20rpm ≤ X4 ≤ 60rpm
Minimize (Surface Roughness) =25.49926+ (-0.08441X1) + (0.040294X2) + (-11.6414X3) + (-0.04084X4)
Conclusion
Results and Discussions
From Figure 5. and Figure 6. It is observed that the results obtained from Microsoft Excel and Experimental Values are more or less the same. Therefore, for further MS Excel analysis, the equation resulted from Microsoft Excel is considered for optimization. Figure 7 presents the goal programming solution calculated using Microsoft Excel and Table 3: presents the results obtained using goal programming.
Figure 8 presents the MATLAB code used for Genetic Algorithm and Fig.9. presents the allotment of variables in Genetic algorithm optimization tool. Table 4: shows results obtained from genetic algorithm. Table 5: presents comparison results obtained from goal programming and genetic algorithm.
From Table 5: presents the optimized results obtained from Genetic Algorithm and Goal Programming. From this, it is observed that rounding the decimals, both the algorithms are yielding the same results, i.e., fill density =40mm/s, shell thickness=3mm, layer height=0.2mm, speed=60mm/s.
Parametric optimization of surface roughness, the length of the rectangular workpiece (ABS) using fused deposition modeling for various parameters has been performed. The process parameters considered are fill density, shell thickness, layer height, and speed. An orthogonal array L27 was used to perform the experiments. Workpiece surface roughness is calculated using the metrological device called Talysurf. Multiple Regression analysis is performed to get the relationship between process parameters and Surface roughness, the length of the workpiece. Then using the equations obtained from multiple regression analysis, a multi-objective optimization is carried out using Genetic, Goal programming. It is observed that both the optimization techniques are yielding the same results. The obtained results are x1=40m/s, x2= 3mm, x3= 0.2mm, x4= 60mm/s. Future Scope
This work can be extended on FDM for other materials like PLA (Polylactic acid), by researching other variables which impact on surface roughness and length, by considering other optimization techniques which are easy to use.
Acknowledgement
Funding for this project work is sponsored by the Department of Mechanical Engineering, Vasavi College of Engineering, Hyderabad
Conclusions
- It was possible to produce cellulose nanofibrils from heart-of-peach palm residue using mechanical fibrillation technique of bleached cellulose pulp.
- TEM analysis confirmed that the obtained this cellulose had nanostructure with average diameter in the range of 20-160 nm.
- Chemical analysis of these fibril suspensions showed about 97.8 g/100g of moisture and 2.2 g/100g of total fiber present in residual amounts. This high moisture content could be due to retention of a great amount of water, which resulted in a gel like suspension.
- The gel of cellulose nanofibrils showed consistency of about 2.4 %, 1.6 % of total nitrogen, and were not detected lipids or monomeric sugars in the gel.
- Toxicity tests of the fibrils on Artemia salina indicated no toxicity at concentrations up to 50 g/L of the suspensions of nanofibrils.
- It is hoped these results will prompt the search for other sources to prepare non-toxicity nanomaterials from waste and by-products.
Acknowledgements
The authors sincerely thank Dayanne Regina Mendes Andrade, Researcher at the Department of Technology of Forestry Products, EMBRAPA, Colombo (PR-Brazil) for her help in conducting the experiments presented in this paper. They acknowledge EMBRAPA for their encouragement, interest in this work and the permission to publish this paper. The authors sincerely acknowledge the Center for Microscopy UFPR, particularly Célia Regina Cavichiolo Franco, who helped in both SEM and TEM studies. This research did not receive any specific grant from funding agencies in the public, commercial, or not-for-profit sectors. However, two of the authors (KGS and WLEM) would also like to thank CNPq for the award of a Fellowship [Processo: 400832/2012-7 dated 21st August 2012] during the course of this work. There was no other role played by the funding agency. Also, Dr. K.G. Satyanarayana would like to express sincere thanks to Poornaprajna Institute for Scientific Research (PPISR), Bengaluru, with whom he has been associated, for their encouragement.
Conflict of Interest
There is no conflict of interest for any of the authors of this paper.
- X He, H Deng, H-m Hwang (2019) The current application of nanotechnology in food and agriculture, Journal of Food and Drug Analysis 27: 1-21.
- D Kalita, S Baruah (2019) Chapter 11 - The Impact of Nanotechnology on Food, Editor(s): Ronaldo Fereira do Nascimento, Odair Pastor Ferreira, Amauri Jardim De Paula, Vicente de Oliveira Sousa Neto, In Advanced Nanomaterials, Nanomaterials Applications for Environmental Matrices, Elsevier 369-79.
- Nanotechnology – A Decade of Progress and Innovation: A Report by the U.S. Food and Drug Administration. Issued July 2020.
- C Moraru, C Panchapekesan, Q Huang, P Takhistov, S Liu, et al. (2003) Nanotechnology: A new frontier in food science. Food Techno. (Chicago) 57: 24-9.
- S Sonkaria, SH Ahn, Khare V (2012) Nanotechnology and its impact on food and nutrition: a review. Recent Patents on Food Nutr. Agr 4: 8-18.
- LM Assis, ER Zavarede, C Prentice-Hernádez LA Souza‐Soares (2012) Review: Characteristics of nanoparticles and their potential applications in foods. Brazilian J Food Technology. (Campinas) 15: 99-109.
- J Weiss, P Takhistov, DJ McClements (2006) Functional materials in food nanotechnology. J Food Science. 71: R107-16.
- The Relevance for Food Safety of Applications of Nanotechnology in the Food and Feed Industries (Food Additives, Chemical Contaminants & Residues) Published by: Food Safety Authority of Ireland Abbey Court, Lower Abbey Street, Dublin 1, 2008.
- Q Choudhry, M Scotter, J Blackburn, B Ross, A Boxall, et al. (2008) Applications and implications of nanotechnologies for the food sector- Review. Food Add. Contam. Part A 25: 241–58.
- M Fondevila (2010) Potential use of silver nanoparticles as an additive in animal feeding. in Silver Nanoparticles. (David Pozo Perez, Ed.) InTech Europe-Croatia: 325-34.
- DJ McClements (2013) Edible lipid nanoparticles: Digestion, absorption, and potential toxicity, Progress in Lipid Research 52: 409-23.
- L Rashidi, K Khosravi-Darani (2011) The applications of nanotechnology in food industry, critical reviews in food. Sci Nutr 51: 723-30.
- R Kalpana Sastry, S Anshul, N Rao (2013) Nanotechnology in food processing sector-An assessment of emerging trends. J Food Science and Technology 50: 831-41.
- D Klemm, F Kramer, S Moritz, T Lindström, M Ankerfors, et al. (2011) A new family of nature-based materials. Angewandte Chemie International Edition. 50: 5438-66.
- L Brinchi, F Cotana, E Fortunati, JM Kenny (2013) Production of nanocrystalline cellulose from lignocellulosic biomass: Technology and applications, Carbohydrate Polymers. 94: 154-69.
- MK Mohamad Haafiz, SJ Eichhorn, A Hassan, M Jawaid (2013) Isolation and characterization of microcrystalline cellulose from oil palm biomass residue, Carbohydrate Polymers 93: 628–34.
- RMA Dayanne, HM Márcia, VH Cristiane, LEM Washington, KG Satyanarayana (2002) Assessment of nano cellulose from peach palm residue as potential food additive: Preliminary studies. J Food Science and Technology 52: 5641-50.
- HPS Abdul Khalil, Y Davoudpour, Nazrul Islam A, Mustapha K, Sudesh R, et al. (2014) Production and modification of nanofibrillated cellulose using various mechanical processes: A review, Carbohydrate Polymers 99: 649–65.
- M Pääkaö, M Ankerfors, H Kosonsen, A Nykänen, S Ahola, et al. (2007) Enzymatic hydrolysis combined with mechanical shearing and high pressure homogenization for nanoscale cellulose fibers and strong gels, BioMacromolecules 11: 1934-41.
- WLE Magalhaes, SA Pianaro, Granado CJF (2013) Satyanarayana, KG. Preparation and Characterization of Polypropylene/Heart-of-Peach Palm Sheath Composite. J Appl Polym Sci 127: 1285-94.
- VS Silva, J Amaya-Farfán, SA Souza, MTB Pacheco (2006) Biological effect of the fiber of palm (Opuntia Opuntial Ficus - Indica Mill) in the production of acids, short chain waxes and Lactate in mice. Braz. J. Food Technol., Ed. Especial, 1: 50-4.
- CB Beatriz, DGD Eliane, PB Adelaide (2013) Peach Palm (Bactris gasipaes kunth) Characterization and the Potential of by-Products Flour Processing. Food Sci. Technol. Res 19: 1061-9.
- CB Beatriz, DGD Eliane, DPB Adelaide (2015) Carbohydrate composition of peach palm (Bactris gasipaes Kunth)by-products flours. Carbohydrate Polymers 124: 196–200.
- SF Talita, DC Potulski, LC Viana, E Forville, AS de Andrade, et al. (2019) Nanocellulose obtained from residues of peach palm extraction (Bactris gasipaes). Carbohydrate Polymers 218: 8-19.
- E Morgado, L Galzerano (2009) Fiber in the nutrition of animals with fermentation in the large intestine. Revista Electrónica de Veterinaria (REDVET). Veterinary Organization, Málaga, Spain 10: 1-13.
- LF Veiga, N Vital (2002) Tests of sharp toxicity with the microcrustáceo Artemia sp. 111-2.
- G Persoone, PG Wells (1987) Artemia in aquatic toxicology: a review. In Artemia Research and its Applications. vol I. Morphology, Genetics, Strain characterization, Toxicology. P. Sorgeloos, D. A. Bengtson, W. Decleir, and E. Jaspers (Eds.) Universa Press, Wetteren, Belgium 380.
- P Kumar, SS Selvi, AL Prabha, M Selvaraj, M Rani, et al. (2012) Antibacterial activity and in-vitro cytotoxicity assay against brine shrimp using silver nanoparticles synthesized from Sagarssum ilicifolium. Digest J Nanomaterials and Biostructures 7: 1447-55.
- S Rajab, A Ramazani, M Hamidi, T Naji (2015) Artemia salina as a model organismo in toxicity assessment of nanoparticles. DARU J Pharmaceutical Sci 20: 30
- B Nunes, FD Carvalho, LM Guilhermino, GV Stappen (2006) Use of the genus Artemia in eco-toxicity testing. Environ. Pol 144: 453-62.
- BM Svensson, L Mathiasson, L Martensson, S Bergstrom (2005) Artemia salina as test organism for assessment of acute toxicity of leachate water from landfills. Environ. Monitor. Assess 102: 309-21.
- FNA de Souza, TCL Correa, LF Garcia, LGV dos Reis, AG Rodriguez (2013) Assessment of toxic potential of Cerrado fruit seeds using Artemia salina bioassay. Food Sci. Technol, Campinas, 33: 251-56.
- WL Braguini, BB Alves, NV Pires (2019) Toxicity assessment of Lavandula officinalis extracts in Brine Shrimp (Artemia salina), Toxicology Mechanisms and Methods.
- GA Bellatto, WL Braguini (2020) Assessment of the use of cooked Araucaria angustifolia seed coats extract as food for brine shrimp, Journal of Environmental Science and Health, Part B.
- M Ates, J Daniels, Z Arslan IO, Farah, HF Rivera (2015) Comparative evaluation of impact of Zn and ZnO nanoparticles on brine shrimp (Artemia salina) lavae: effects of particle size and solubility on toxixity. Environmental Science: Processes & Impacts 15: 225-33.
- M Ates, J Daniels, Z Arslan, IO Farah (2015) Effects of aqueus suspension of titanium dioxide nanoparticles on Artemia salina: assessment of nanoparticle aggregation, accumulation, and toxicity. Environ Monit Assess 185: 3339-48.
- Y Daglioglu, I Altinok, H Ilhan, M Sokmen (2016) Determination of the acute toxic effect of ZnO-TiO2 nanoparticles in brine shrimp (Artemia salina). Acta Biologica Turcica 29: 6-13.
- Arulvasu C, Jennifer SM, Prabhu D, Chandhirasekar D (2014) Toxicity effect of silver nanoparticles in brine shrimp Artemia. The Scientific World Journal. 2014: 10.
- C Gambardella, T Mesaric, T Milivojevic, K Sepcic, L Gallus, et al. (2014) Effects of selected metal oxide nanoparticles on Artemia salina larvae: evaluation of mortality and behavioural and biochemical responses. Environ Monit Assess, 186: 4249-59.
- T Mesaric, C Gambardella, T Milivojevic, M Faimali, D Drobne, et al. (2015) High surface adsorption properties of carbon-based nanomaterials are responsible for mortality, swimming inhibition, and biochemical responses in Artemia salina larvae. Aquatic Toxicology 163: 121-9.
- ABNT: NBR 14853: Wood (2008) Determination of soluble material in ethanol-toluene and in dichloromethane and in acetone.
- ABNT: NBR 7989 (2010) Association of Brazilian Standards: ABNT: NBR 7989: Celluloe Paste and wood - Determination of insoluble lignin in acid.
- R Rowell (1984) The Chemistry of Solid Wood; Advances in Chemistry Series No.207. American Chemical Society, Washington, DC, USA.
- LE Wise, M Murphy, AAD’Addieco (1946) Chlorite holocellulose, its fractionation and bearing on summative wood analysis and studies on the hemicelluloses. Paper Trade J 122: 35-43.
- Brasil, Ministry of Health (2005) National Agency of Sanitary Surveillance. Physico-chemical methods for food analysis. Brasília, Brazil.
- Y Jiang, X Liu, Q Yang, X Song, C Qin, S Wang et al. (2018) Effects of residual lignin on mechanical defibrillation process of cellulosic fiber for producing lignocellulose nanofibrils. Cellulose, 25: 6479–94.
- Instituto Adolfo Lutz (2008) Physicochemical methods for food analysis.
- AJ Bombo (2006) Obtaining and nutritional characterization of corn (zea maysL.) and flaxseed (Linum usitatissimumL.) snacks. Dissertation (Masters in Public Health), Faculty of Public Health, University of São Paulo.
- MR Silva, MS Silva, KA Martins, S Borges (2001) Technological use of Jatobá-do-cerrado and Jatobá-da-mata fruits in the preparation of sugar-free, dietary fiber biscuits 21: 176-82.
- Brazil Legislation. Ministry of Health (2003) National Health Surveillance Agency. Resolution-RDC nº 360 of December 23, 2003. Provides for the technical regulation of nutritional labeling of packaged foods. Official Gazette of the Federative Republic of Brazil.
- RS Sousa, AS Andrade, ML Masson (2021) Extraction and characterization of nanofibrillated cellulose from yacon plant (Smallanthus sonchifolius) stems. Polímeros: Ciência e Tecnologia 31: e2021016.
- TAT Yasim-Anuar, H Ariffin, MA Hassan (2018) Characterization of cellulose nanofiber from oil palm mesocarp fiber produced by ultrasonication. The Wood and Biofiber International Conference (WOBIC 2017) IOP Publishing; IOP Conf. Series: Materials Science and Engineering 368: 012033.
- A Chaker, S Boufi (2015) Cationic nanofibrillar cellulose with high antibacterial properties. Carbohydrate Polymers 131: 224-32.
- GHD Tonoli, EM Teixeira, AC Corrêa, JM Marconcini, LA Caixeta, et al. (2012) Cellulose micro/nanofibres from Eucalyptus kraft pulp: Preparation and properties. Carbohydrate Polymers, 89: 80–8.
- X Andrade-Mahecha, MM Pelissari, FM Tapia-Blácido, DR, Menegalli FC (2015) Achira as a source of biodegradable materials: Isolation and characterization of nanofibers. Carbohydrate Polymers, 123: 406-15.
- JC Benassi (2004) The use of bioindicators and biomarkers in the evaluation of the leachate leachate remediation process using chitosan microspheres. University of the Extreme South of Santa Catarina –UNESC.
- JM de Siqueira, MG Ziminiani, U Maria Resende, MAD Boaventura (2001) Phytochemical study of Unonopsis lindmanii biomonitored by the toxicity test on Artemia salina 24: 185-7.
- AG Rodriguez, OM Teixeira, FG Salles, JP Vitl, DS Peixoto (2009) Artemia Salina Bioassay for Detection of Toxins in Vegetable Foods 36: 795-808.
FIGURE 1
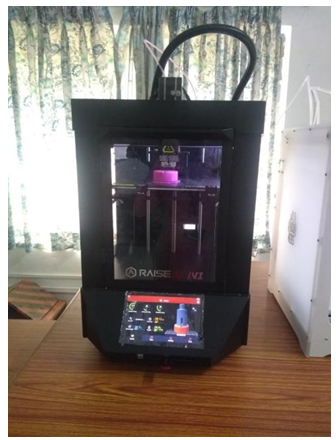
Figure 1: Fused deposition modeling machine (Courtesy: Vasavi College of Engineering)
FIGURE 2
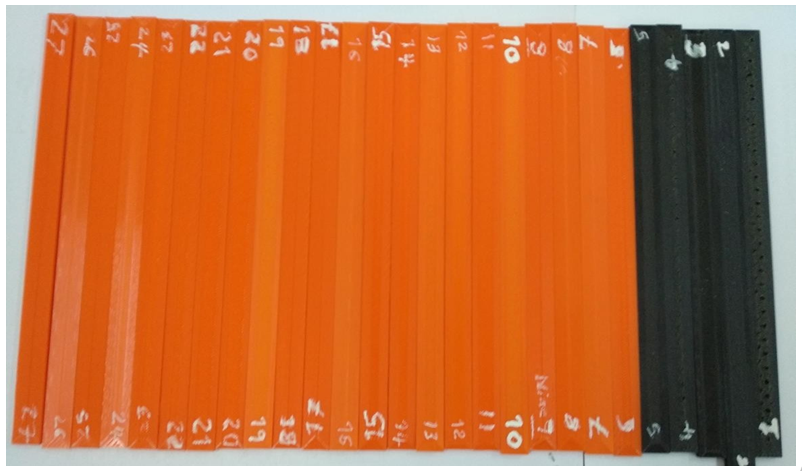
Figure 2: Rectangular workpieces after fabrication on FDM machine
FIGURE 3
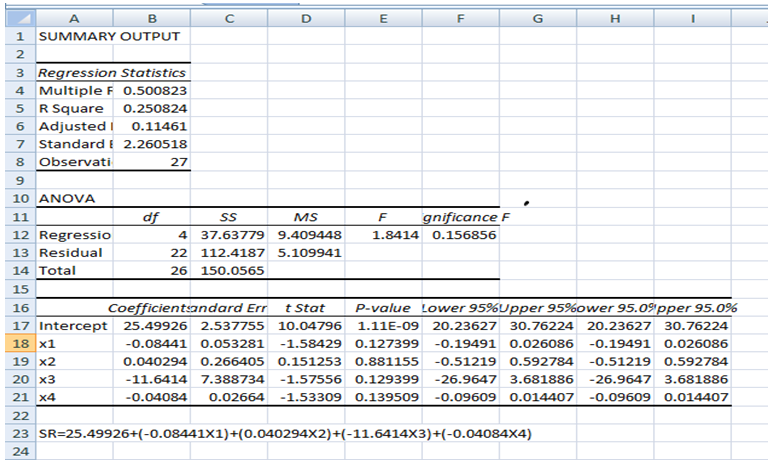
Figure 3: Summary Report and Regression equation for surface roughness
FIGURE 4
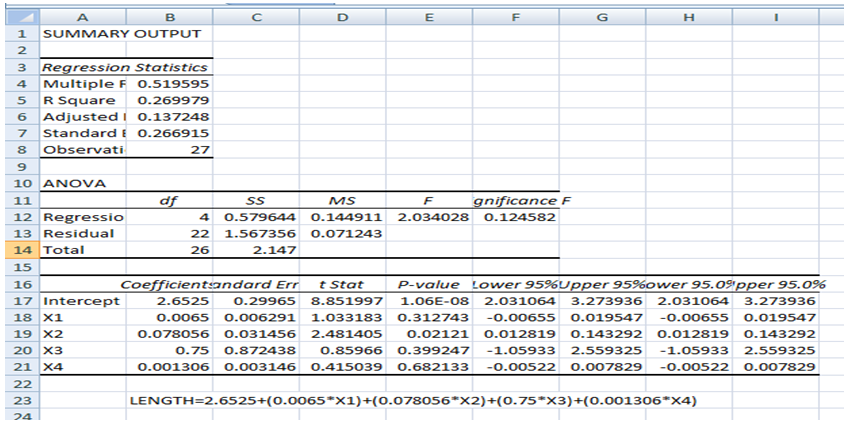
Figure 4: Summary Report and Regression equation for the length
FIGURE 5
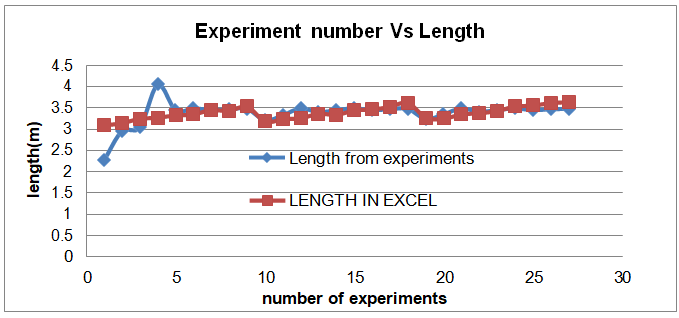
Figure 5: Experiment number Vs length
FIGURE 6
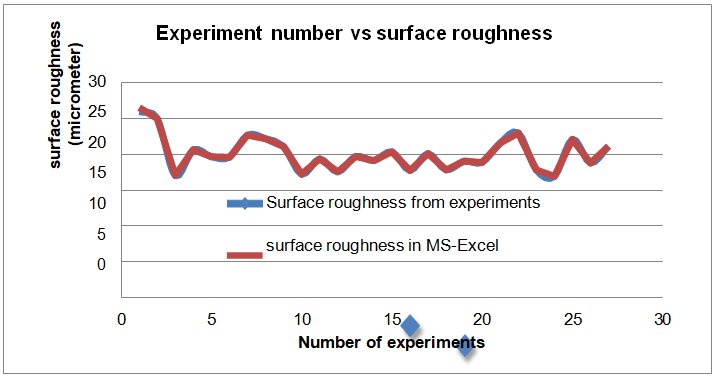
Figure 6: Experiment number Vs surface roughness
FIGURE 7
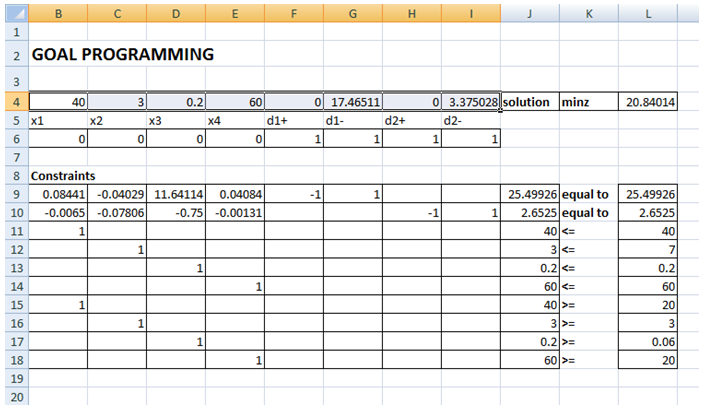
Figure 7: Goal programming solution in Microsoft Excel
FIGURE 8
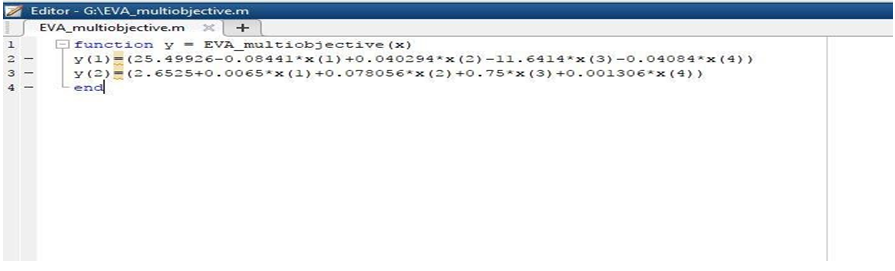
Figure 8: MATLAB code for GA
FIGURE 9
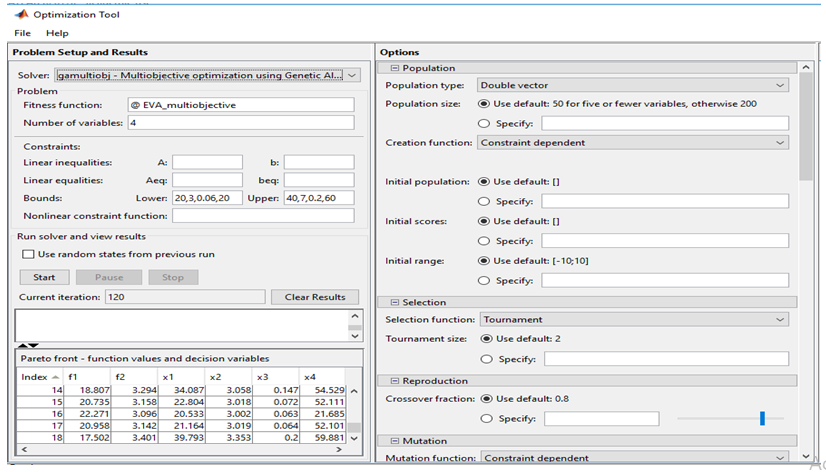
Figure 9: GA function values and decision variables
Tables at a glance
Figures at a glance