S.N O
X1
X2
X3
X4
Surface Roughness (µm)
Length(m)
1
20
3
0.06
26.5624
2.28
2
0.1
40
25.05
2.96
0.2
60
17.0742
3.04
4
5
20.6803
4.05
19.707
3.44
6
19.6453
3.49
7
22.715
3.45
8
22.2216
3.47
9
21.141
3.48
10
30
17.2513
3.21
11
19.402
3.33
12
17.5803
13
19.7496
3.4
14
19.1703
15
20.3823
16
17.7786
17
20.1396
18
17.8646
19
19.0826
3.24
18.9223
3.35
21
21.6203
22
23.0316
3.41
23
17.8516
24
16.9586
25
22.132
26
18.8296
27
21.174
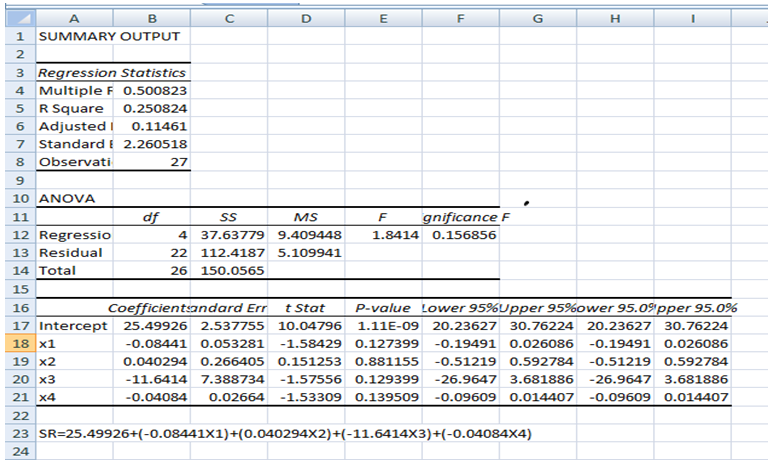
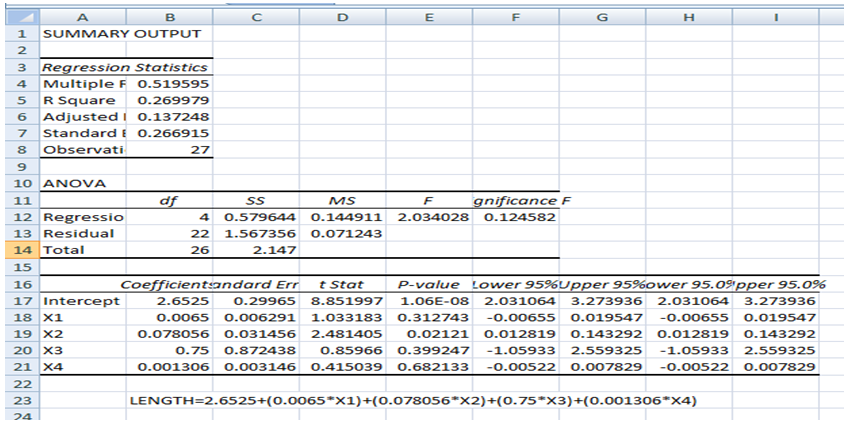
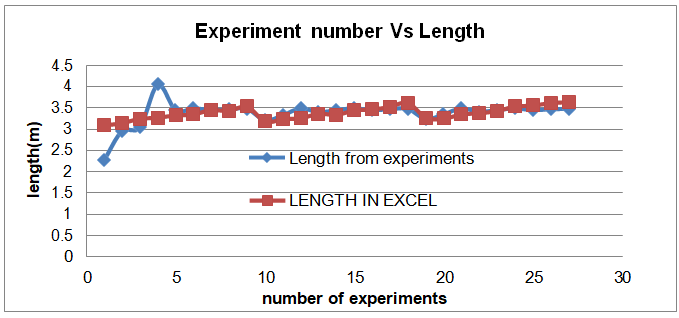
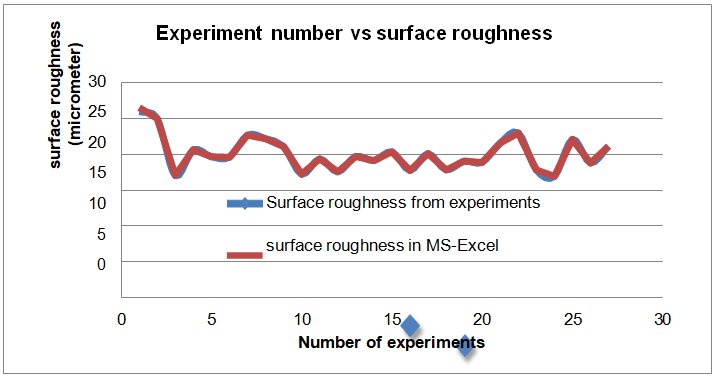
Table 1: Experimental data for surface roughness and the length
S.NO
Surface Roughness(µm)
SR in Excel Data
Length in Excel data
26.564
3.08778
3.14398
17.072
3.24508
20.683
3.27002
3.32614
19.643
3.3489
3.45222
22.226
3.43002
3.53112
17.253
3.17898
3.23508
17.583
3.25778
19.746
3.36114
19.173
3.3389
20.383
3.44002
17.776
3.46502
20.136
3.52112
17.866
3.62222
19.086
3.27008
18.923
3.24778
21.623
3.34898
23.036
3.3739
17.856
16.956
3.53114
3.55612
18.826
3.61222
3.63502
Table 2: Experimental data and excel data for the surface roughness
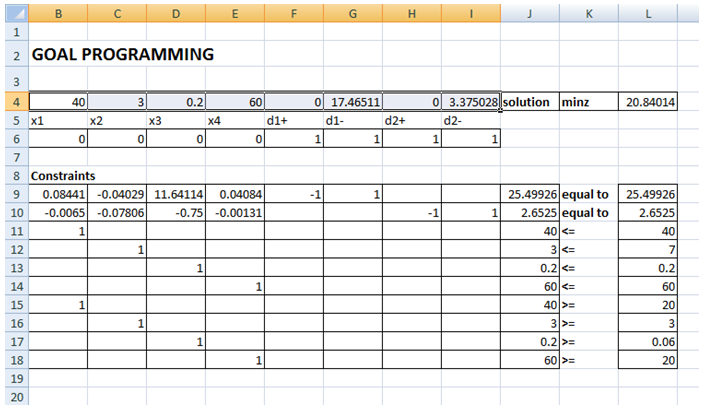
Fill density(mm/s)
Shell thickness(mm)
Layer height(mm)
Speed(mm/s)
Table 3: Results obtained from Goal Programming
Fill density(mm\s)
39.793
3.353
Speed(mm\s)
59.881
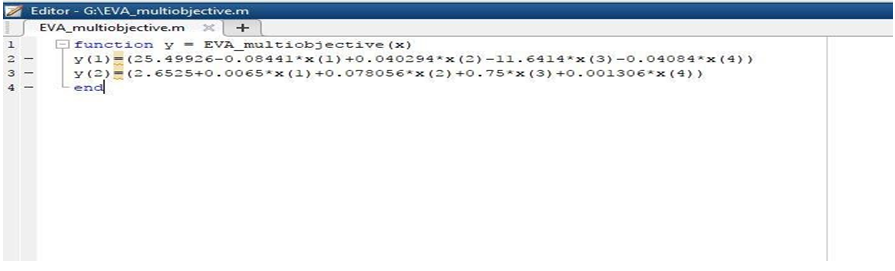
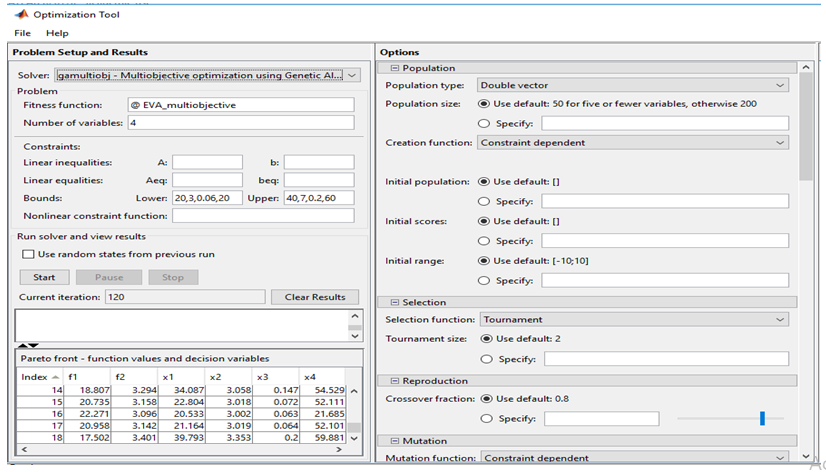
Table 4: Results obtained from the Genetic algorithm
Parameters
Genetic Algorithm
Goal programming
Table 5: Comparison between the Genetic algorithm and Goal Programming
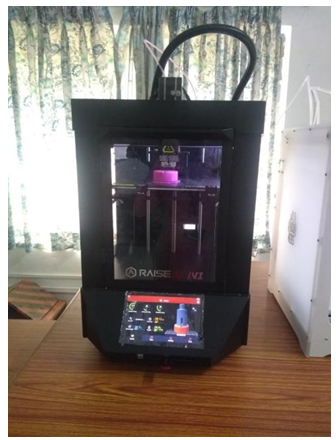
Figure 1: Fused deposition modeling machine (Courtesy: Vasavi College of Engineering)
Tables at a glance
Figures at a glance