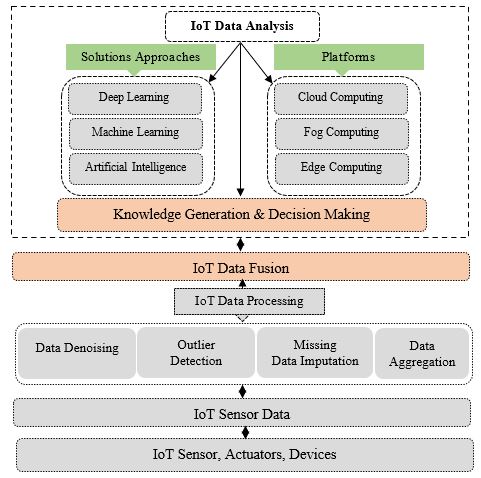
Figure 1: The basic architecture for IoT sensor data processing, data fusion and data analysis
Figure 1: The basic architecture for IoT sensor data processing, data fusion and data analysis
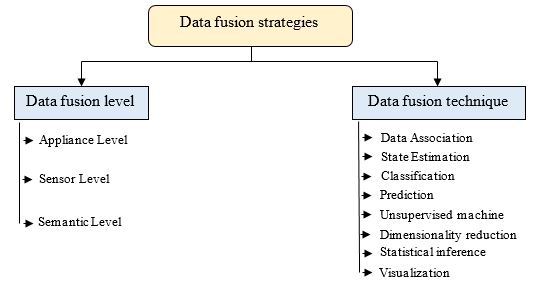
Figure 2: Taxonomy of data fusion strategies
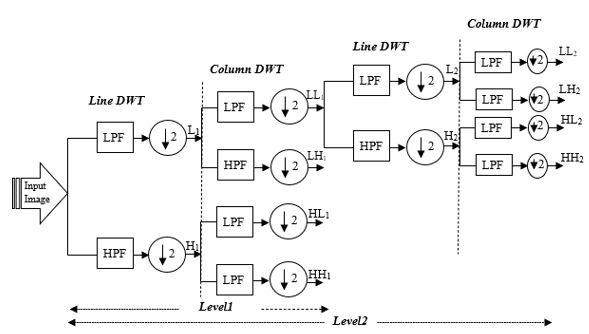
Figure 3: Two-level decomposition algorithm for 2-D DWT
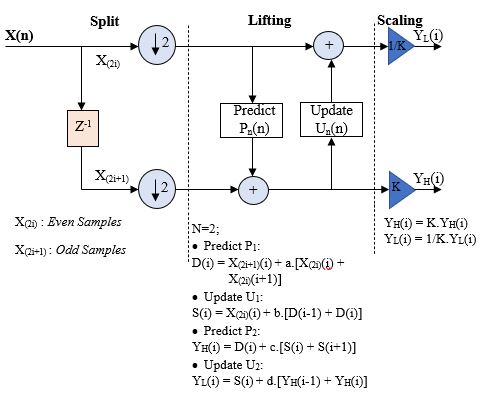
Figure 4: The implementation of the 1D-DWT lifting scheme
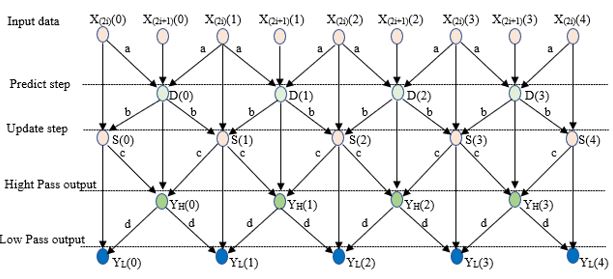
Figure 5: The schematic of 1-D DWT using lifting scheme for (9, 7) filter
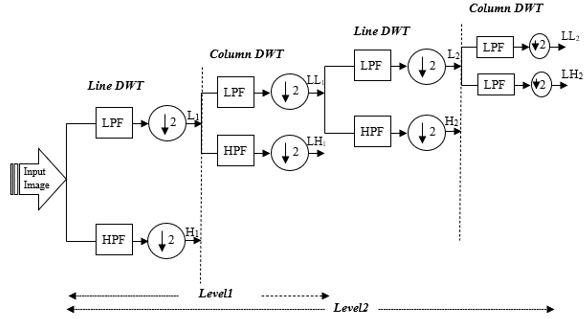
Figure 6: Two-level decomposition algorithm for SHPS technique
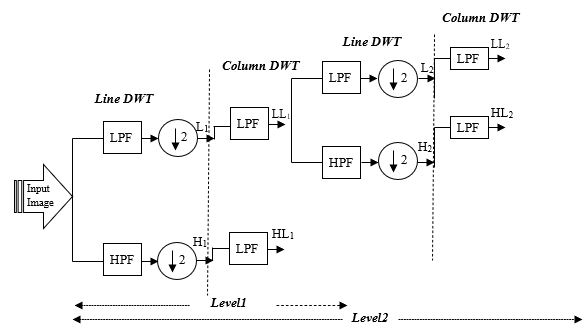
Figure 7: Two-level decomposition algorithm for EHPF technique
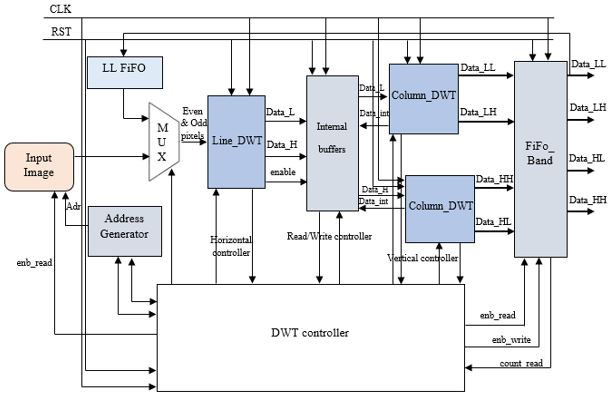
Figure 8: The block diagram of the proposed 2D-DWT architecture
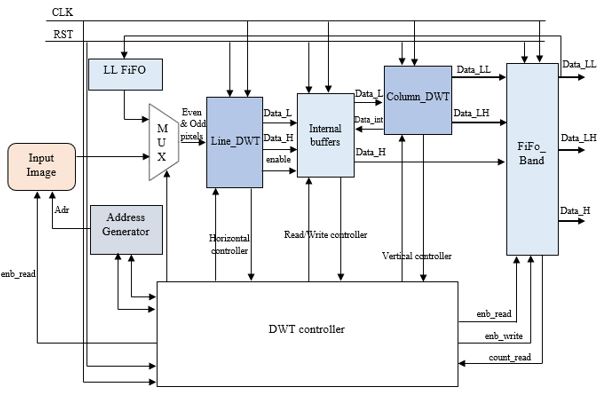
Figure 9: The block diagram of the proposed SHPS architecture.
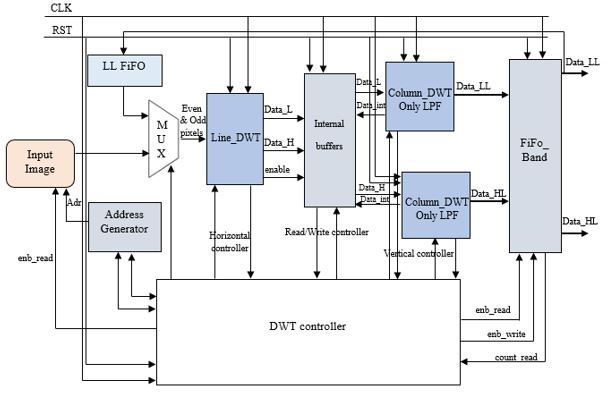
Figure 10: The block diagram of the proposed EHPF architecture
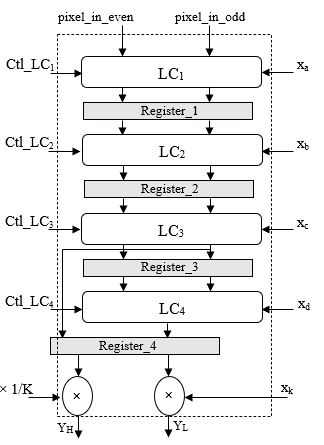
Figure 11: 1D-DWT architecture block diagram
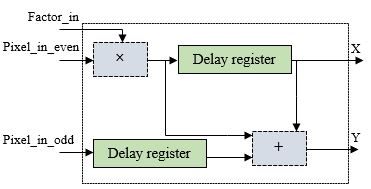
Figure 12: Each Lifting Computation's basic architecture
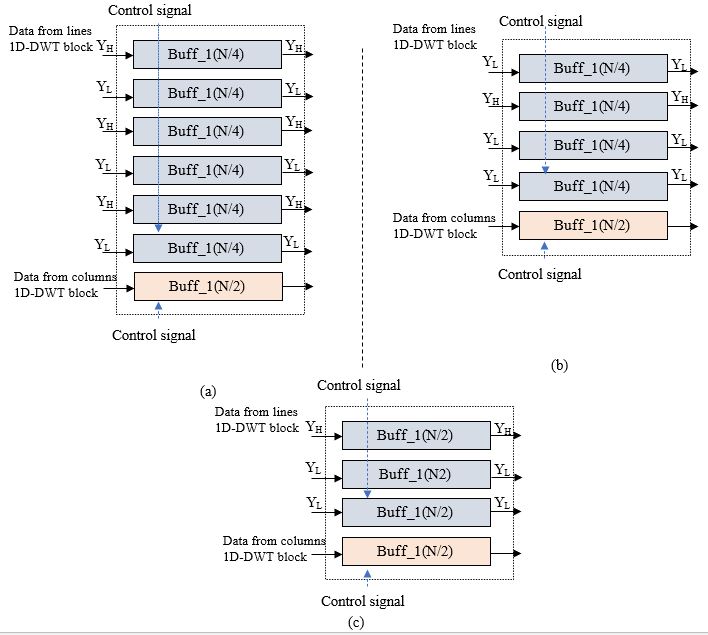
Figure 13: Internal buffers structure for: (a) (9, 7) filter; (b) SHPS technique; (c) EHPF technique
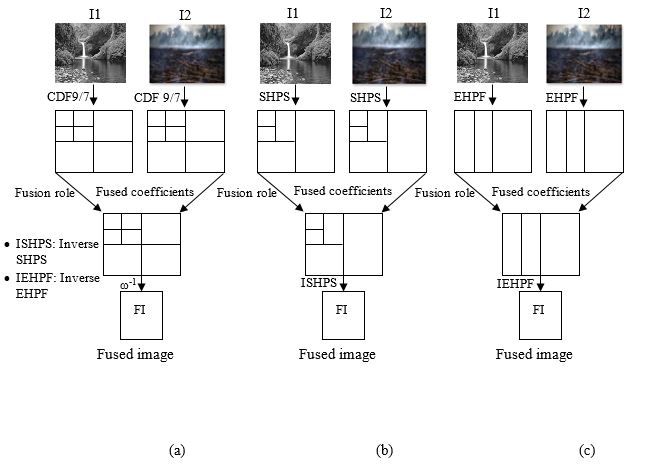
Figure 14: 14: Schematic Diagram of Image Fusion. (a) Image Fusion-based DWT; (b) Image Fusion-based SHPS; (c) Image Fusion-based EHPF
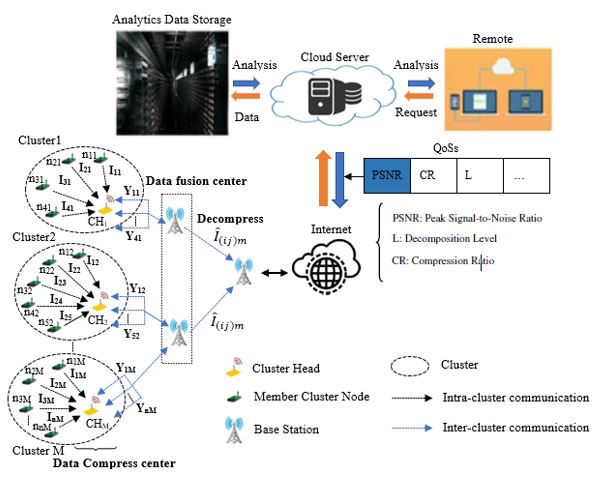
Figure 15: The intelligent monitoring system-based approach
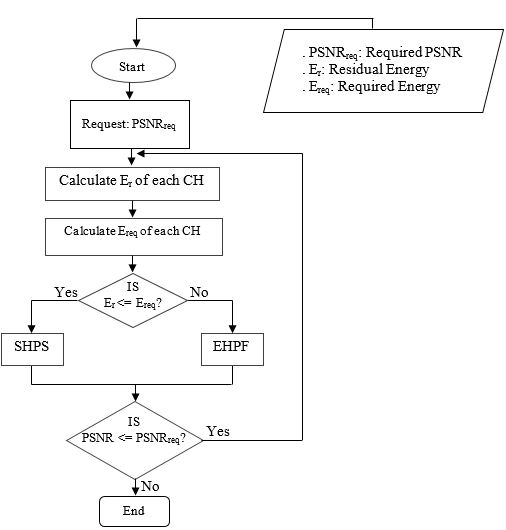
Figure 16: Flowchart of EEWIFT
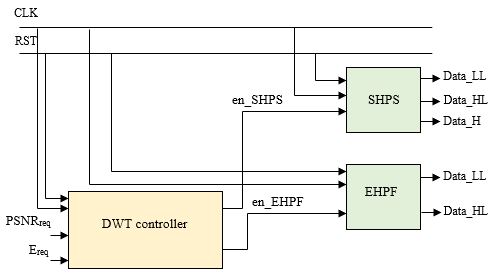
Figure 17: The block diagram of the proposed EEWIFT
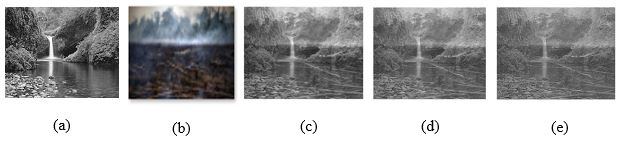
Figure 18: Visual results of fused image. (a) Input source image1 (b) Input source image2 (c) CDF 9/7-based fusion: PSNR= 16.52 dB; (d) EHPF-based fusion: PSNR = 13.88 dB; (e) SHPS-based fusion: PSNR= 12 dB
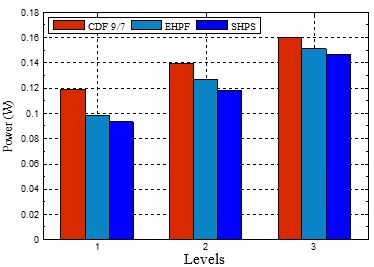
Figure 19: Power consumption comparison between CDF 9/7 DWT and proposed approaches
Tables at a glance
Figures at a glance