FIGURE
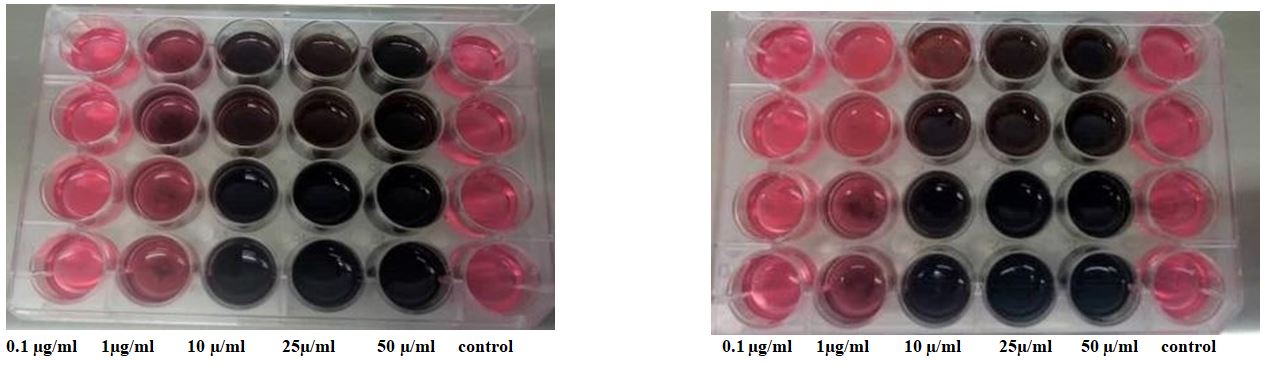
Figure 1: Culture plate of A549 and MCF-7 cancer cells with concentrations of o.1 to 50 μg/ml of nanodrug
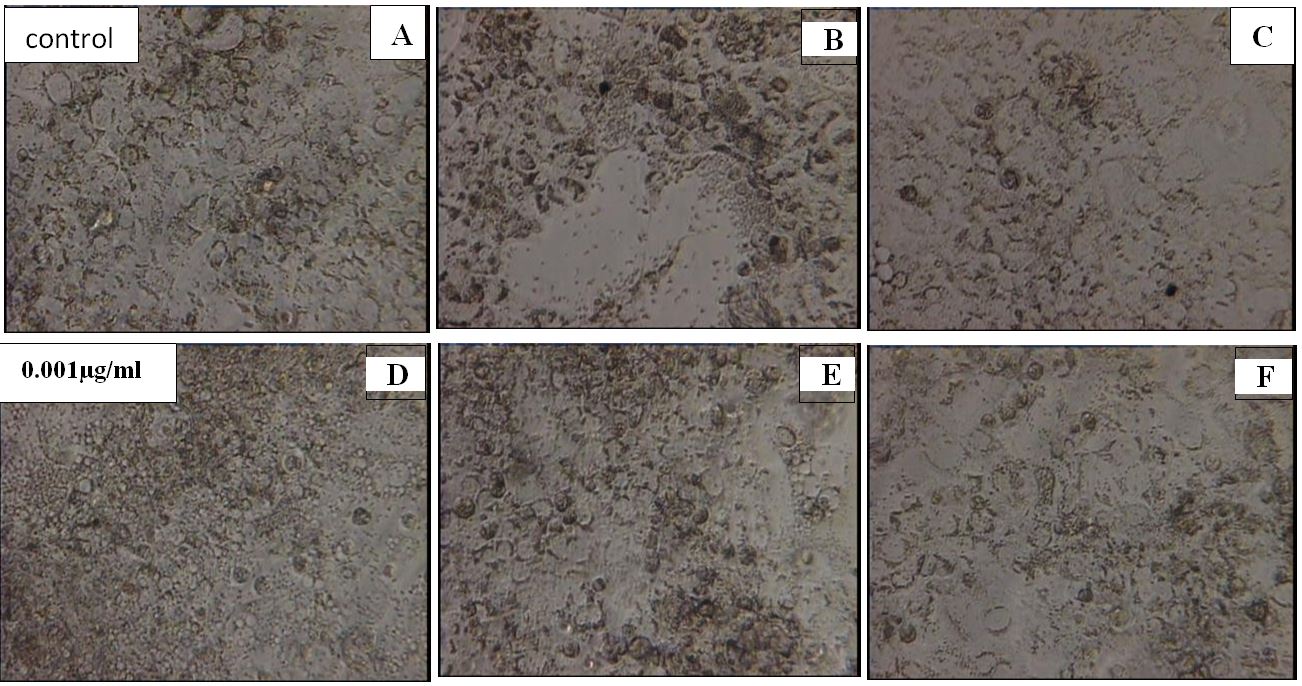
Figure 2: Microscopic images of the effect of different doses of nanodrug on MCF-7 cancer cell line under different conditions of application of doses (A=control, B=0.1, C=0.01, D=0.001 μg/ml), E= 0.1, F=0.01 ng/ml after 72 hours
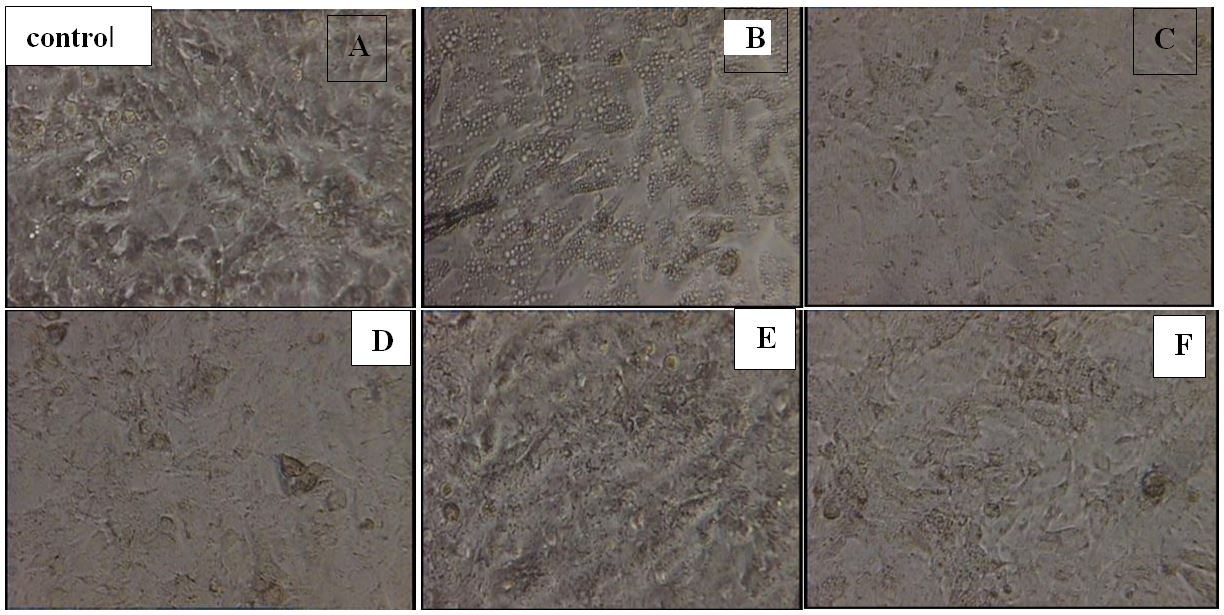
Figure 3: Microscopic images of the effect of different doses of nanodrug on A549 cancer cell line using different doses (A=control, B=0.1, C=0.01, D=0.001 μg/ml), E= 0.1, F=0.01 ng/ml after 72 hours
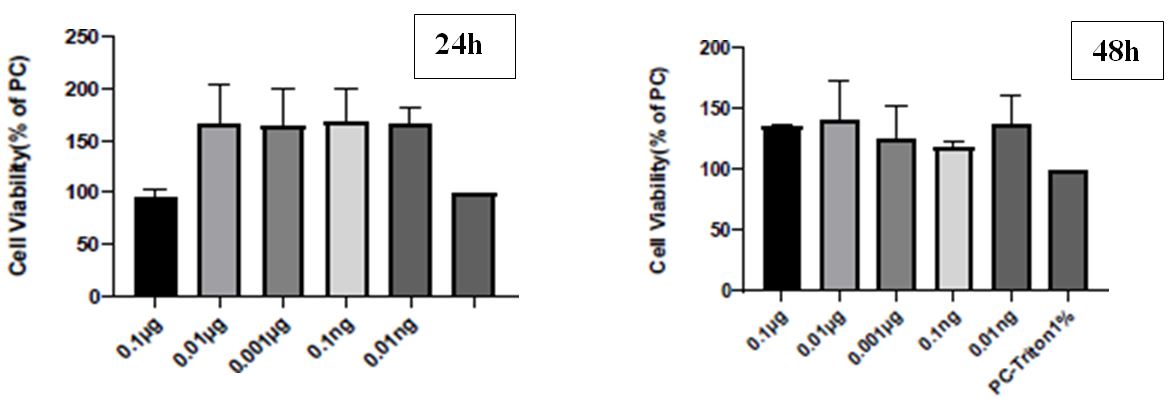
Figure 4: LDH of different types of cell viability factor (PC %)) using various concentrations (μg/ml and ng/ml) of the nanodrug for MCF-7 cell lines in five doses compared to Triton X-100 1% as a control, (# = p<0.05)
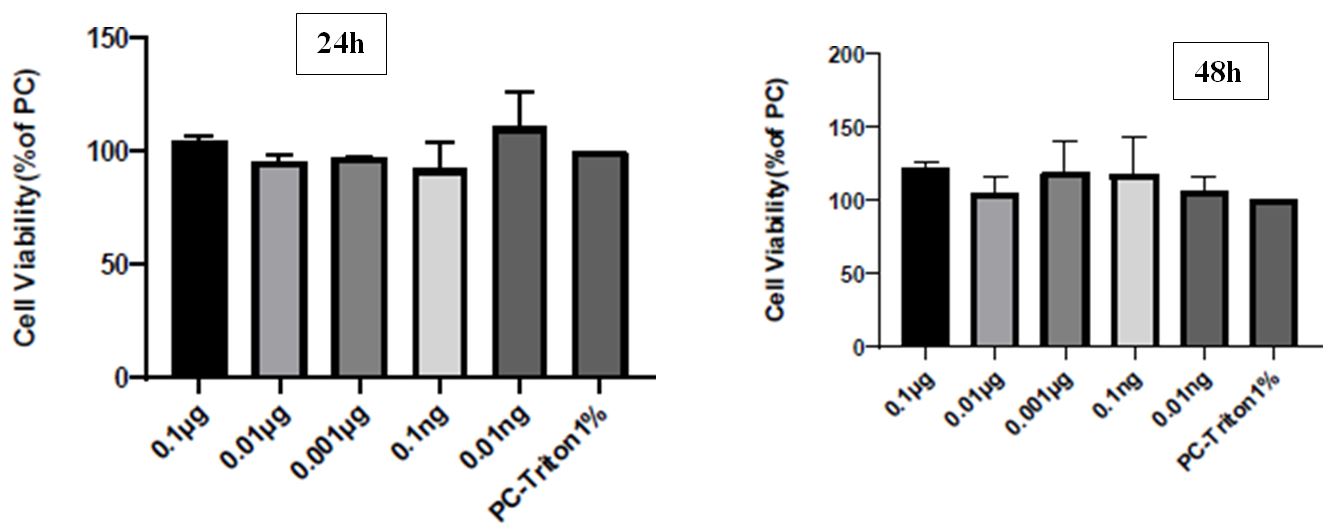
Figure 5: LDH presentation of different types of cell viability factor (PC %)) using various concentrations (μg/ml and ng/ml) of the nanodrug for A549 cell lines, including five doses compared to Triton X-100 1% as a control, (# = p<0.05)
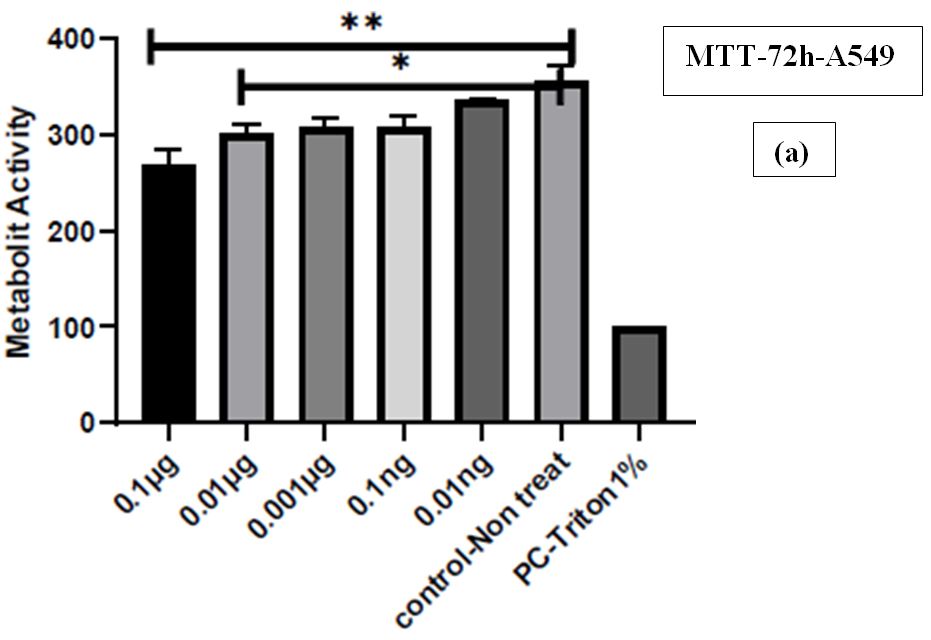
Figure 6: Reduction in cellular metabolic activity of A459 (a) and MCF-7 (b) cell lines by MTT assay using advanced synthetic nanodrug after 72h
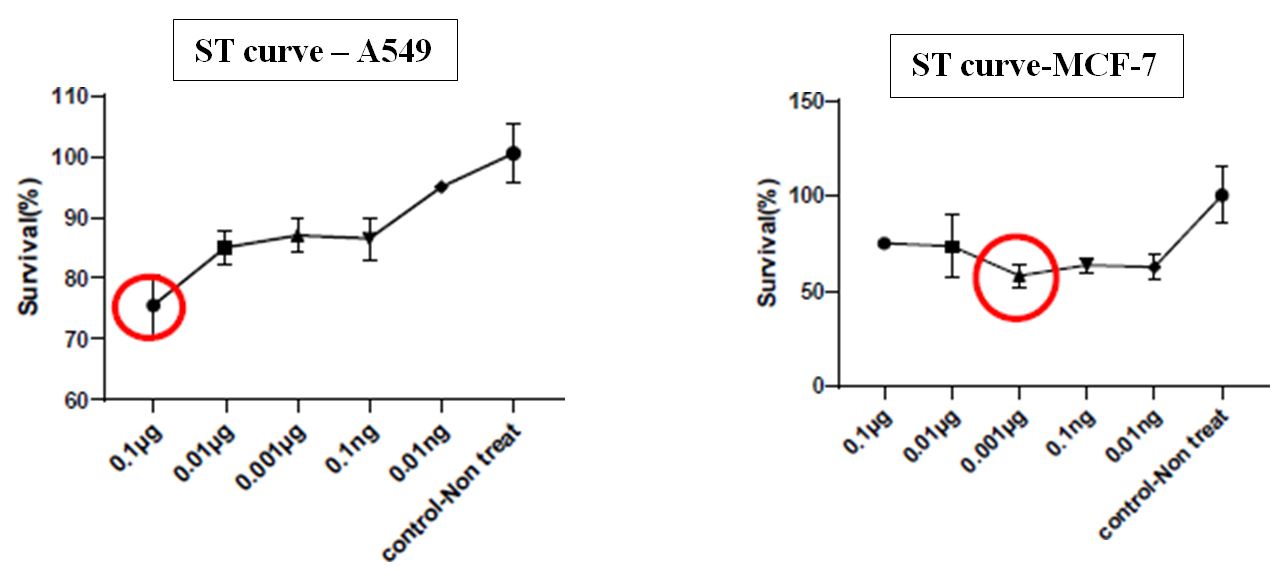
Figure 7: Standard diagram survival % curve in terms of 5 selected doses compared to the control group for A549 and MCF-7 cell lines
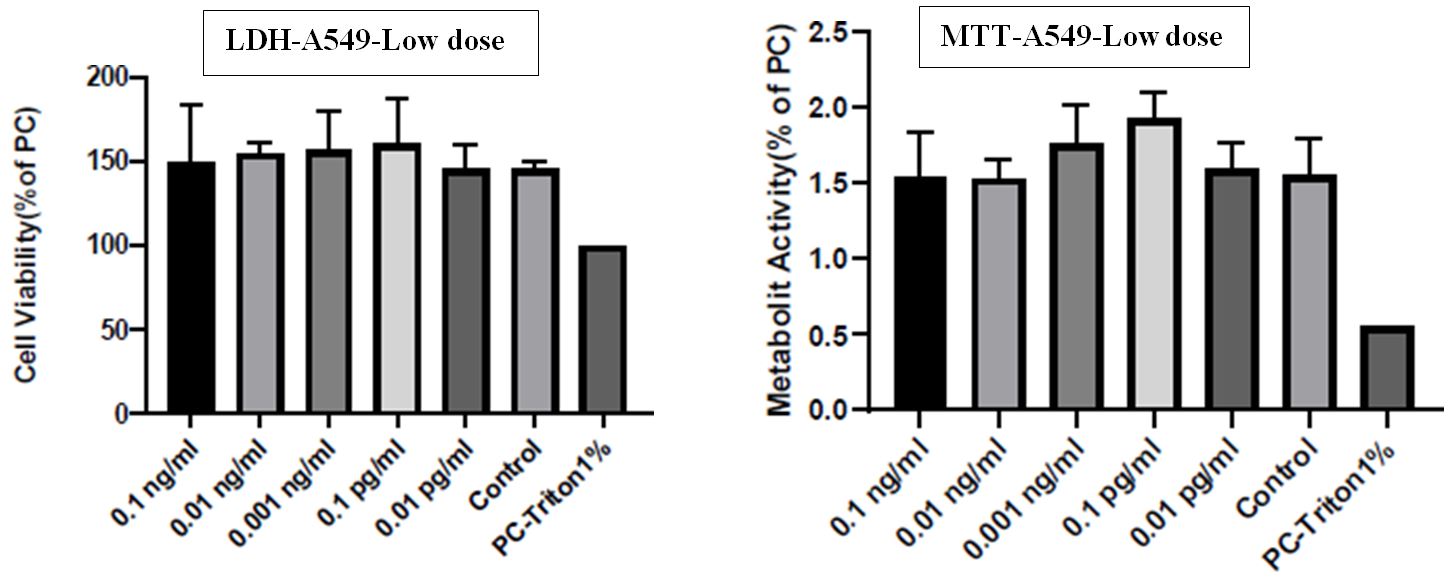
Figure 8: Demonstration of three curves, LDH, MTT and ST at low doses of nanodrug for A549 cell lines. The lowest non-lethal concentration of 0.1 pg/ml was reported
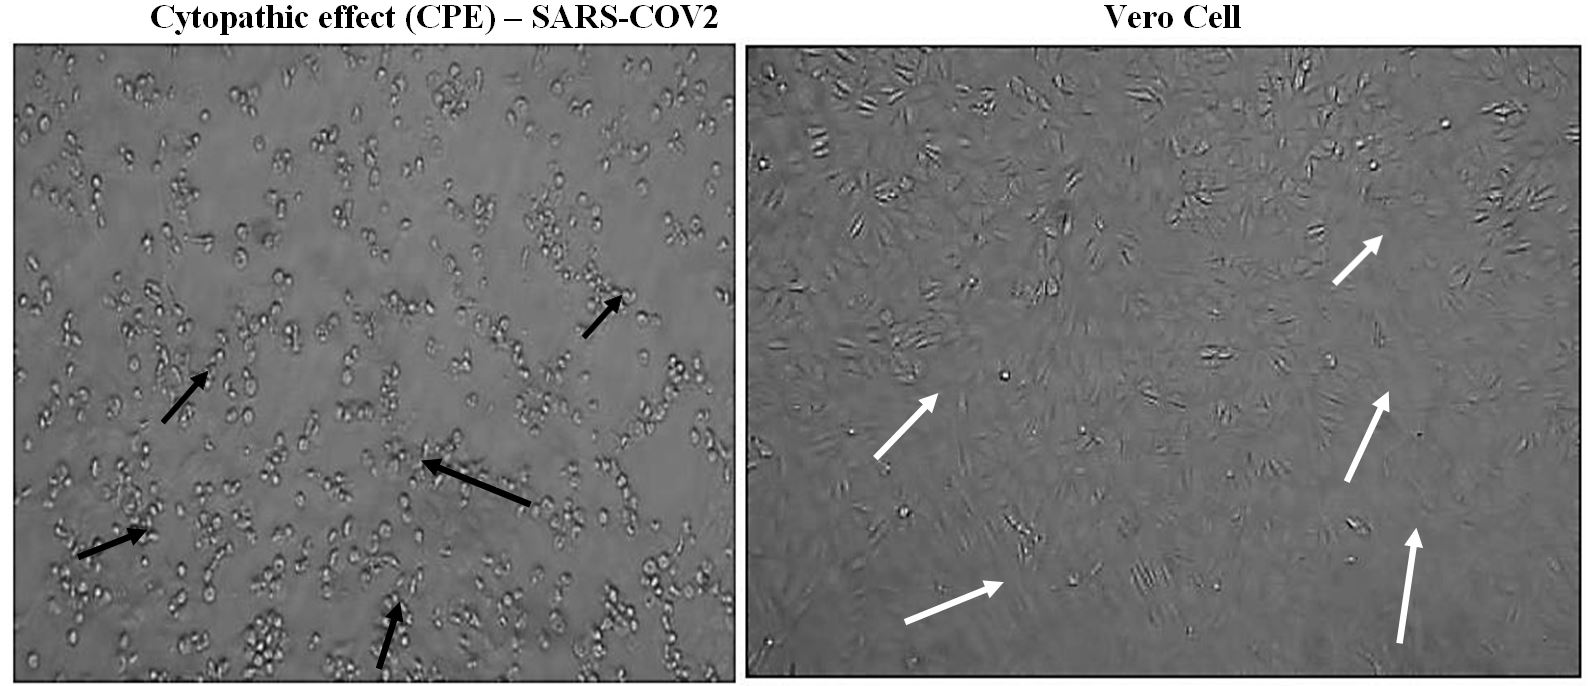
Figure 9: Images of cytopathic effect (CPE)-SARS-COV2 in comparison to Vero cell. This refers to structural or cell morphology changes for a period of time in host cells caused by viral invasion. These pictures may help the diagnosis of viral disease. Black arrows indicate SARS COV 2-induced cytopathic effects and the location of the structure damage and destruction. White arrows show the area where all infected cells were completely detached and floating in the culture medium and are healthy (dose-limiting toxicities in patients)
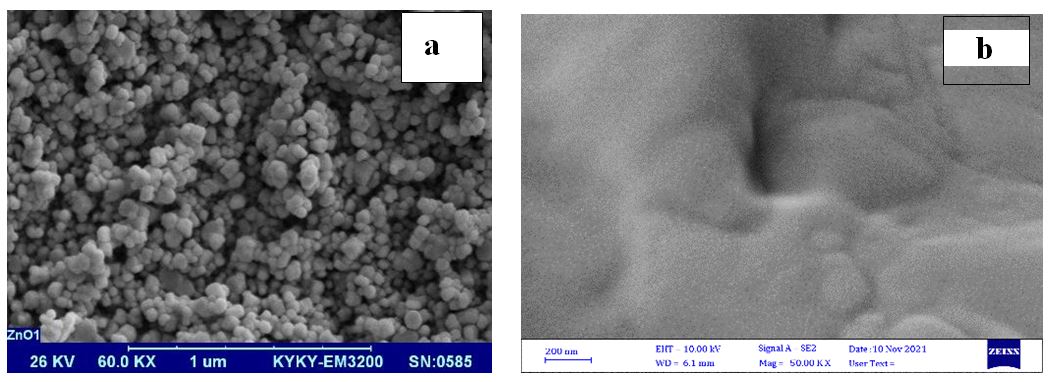
Figure 10: SEM images of the spherical surface morphology of ZnO NPs (a), and nanodrug product solution (b) which contains various types of nanoparticles in nanofluid
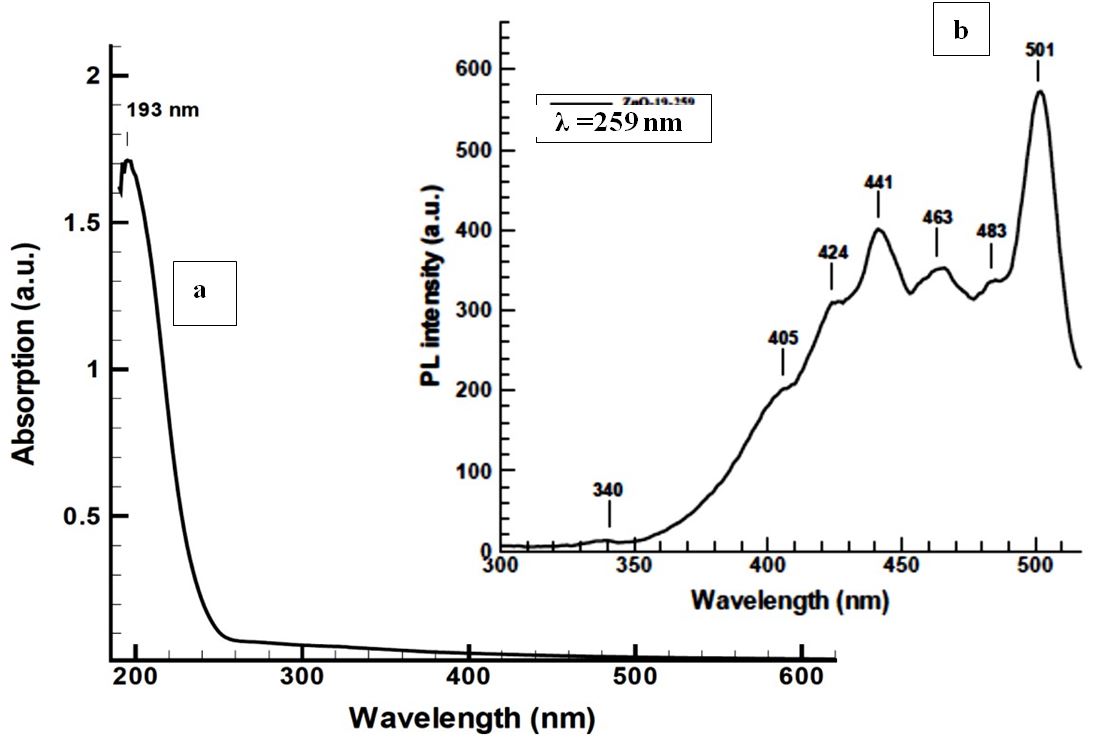
Figure 11: Nanoparticles exhibited high absorption peak at 193 nm in UV-visible (a) and individual photoluminescence emission in the UV-Vis region (b) containing types of surface oxygen vacancies and trapping states as high ladder shaped peaks
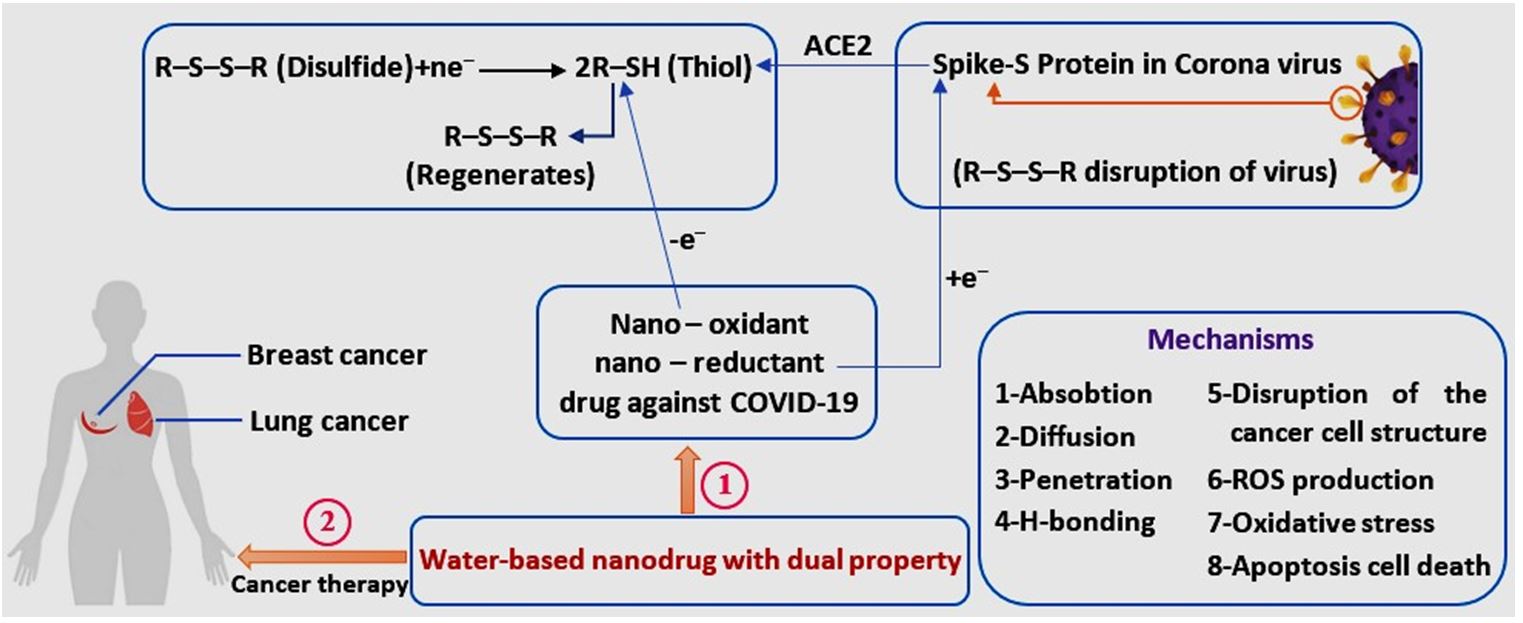
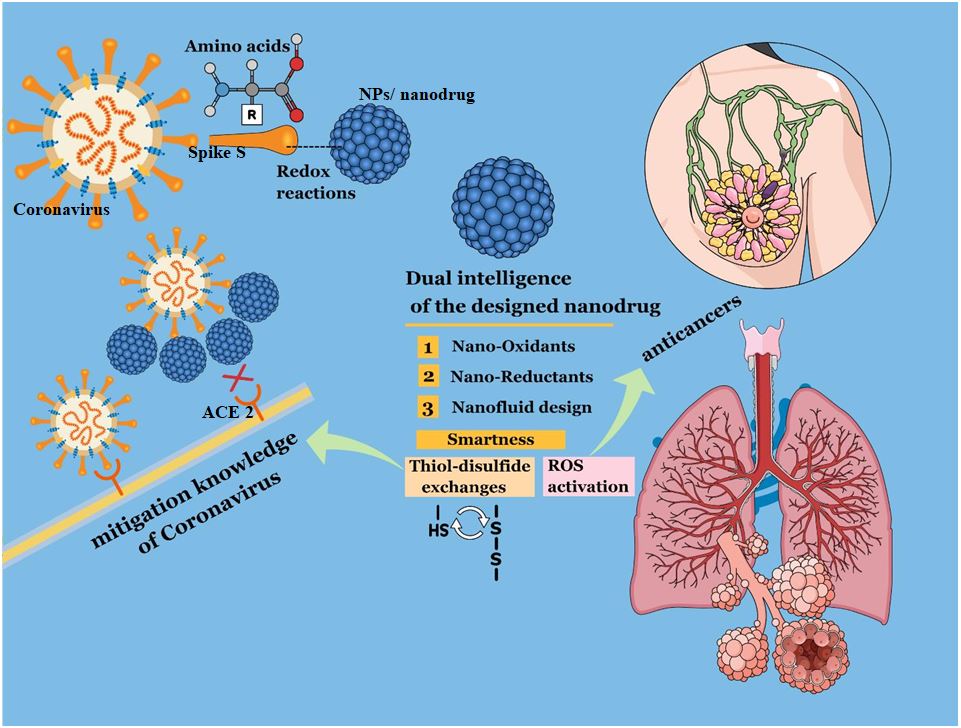
Figure 12: Indicates the dual properties of nanodrug for use in the treatment of COVID-19 and cancer
Tables at a glance
Figures at a glance