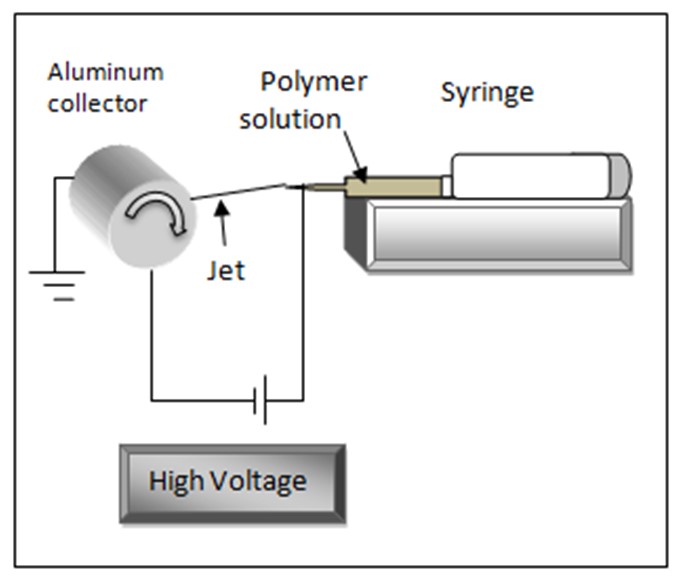
Figure 1: Schematic setup of electrospinning.
Figure 1: Schematic setup of electrospinning.
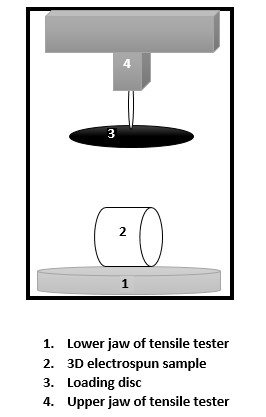
Figure 2: Schematic set up for compression by Instron tensile tester.

Figure 3: Schematic setup for indentation by Instron tensile tester.

Figure 4: Different cross-sections; circular and oval (elliptic)

Figure 5: SEM image of electrospun polyurethane layer.
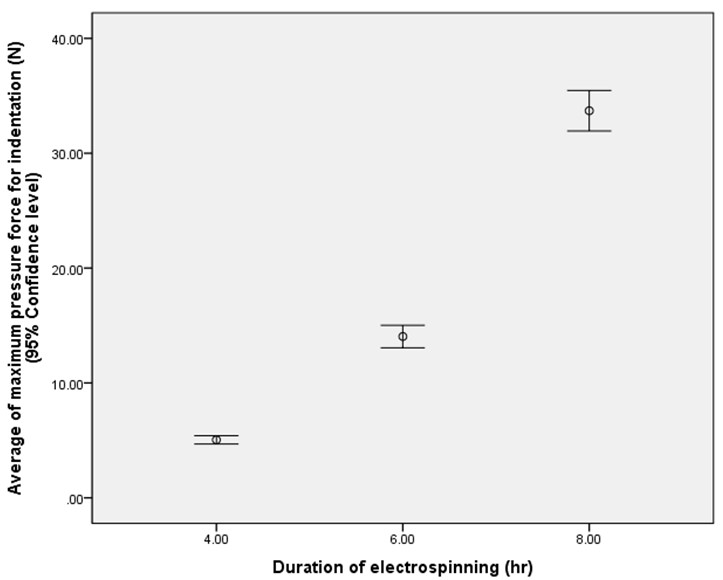
Figure 6: Effect of electrospinning duration (thickness) on the indentation force.
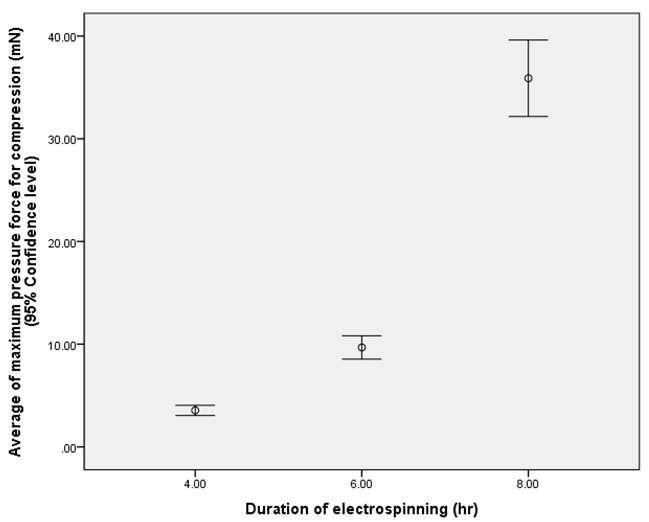
Figure 7: Effect of electrospinning duration (thickness) on compression force.
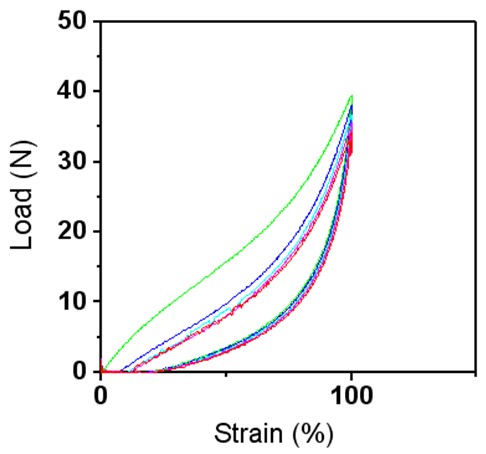
Figure 8: shows the relationship between load and strain in the cyclic loading for the electrospun PU layer.

Figure 9: The average of tension and the amount of average extension at 25%, 50%, 75%, and 100% of strain
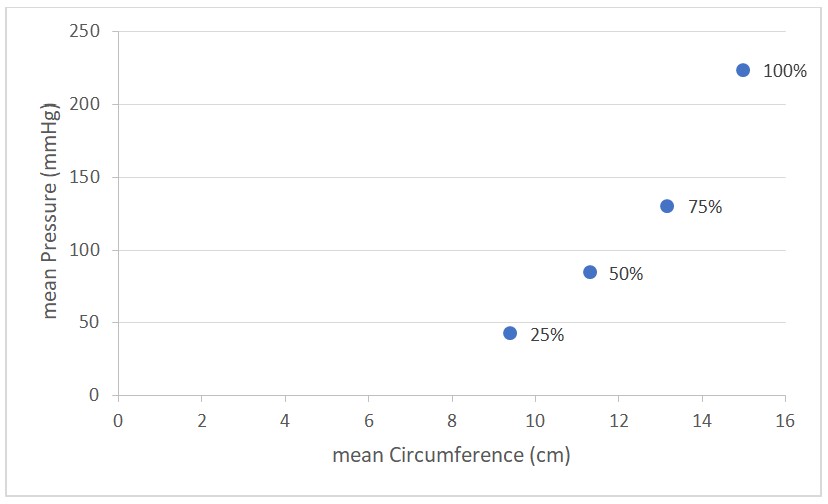
Figure 10: Average of calculated pressure of circular cross-sectional body limb at different amounts of extension different amounts of reduction factor
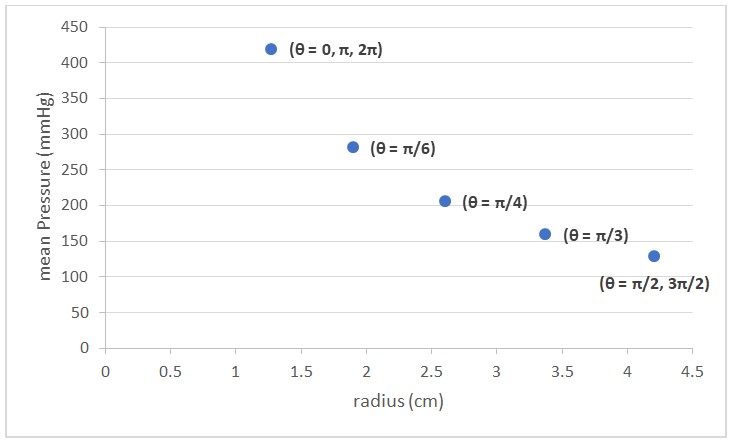
Figure 11: Average of calculated pressure for oval (Elliptic) cross-sectional body limb at different radiuses depending on the angles at 100% of strain
Tables at a glance
Figures at a glance