Table 2: List of parameters in the Bethe-Bloch equation
Table 2: List of parameters in the Bethe-Bloch equation
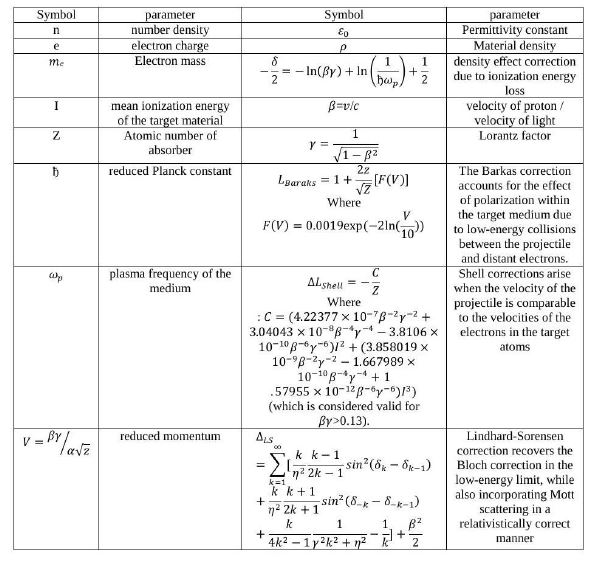
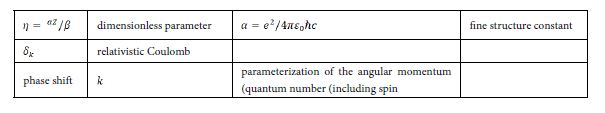
(Hight: H = 23 cm, Width: W = 28 cm and Depth: D = 13.7 cm)
Figure 1: The dimensions of the anatomical lung phantoms a) the right lung b)the left lung.
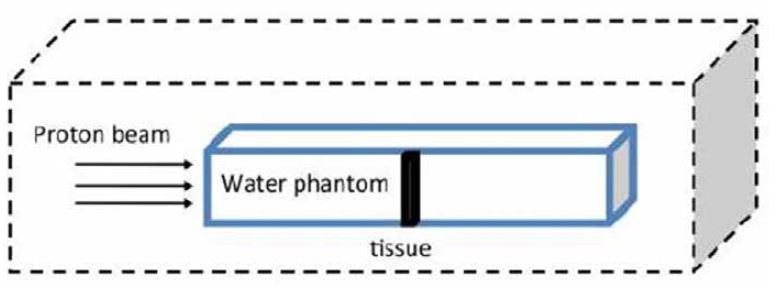
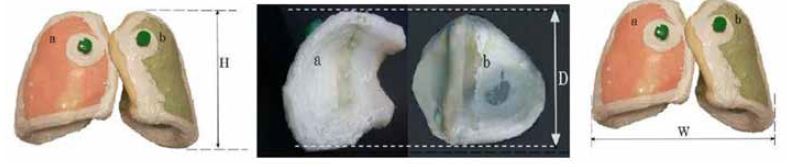
Figure 2: A plan for the selected phantom used in this study
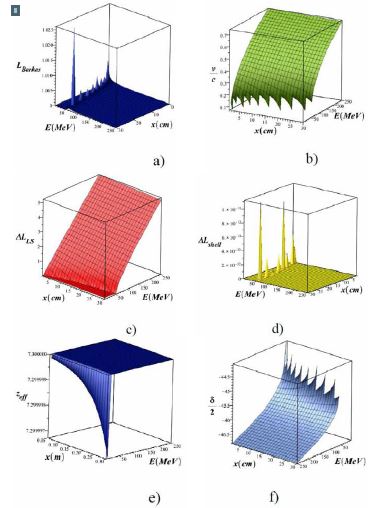
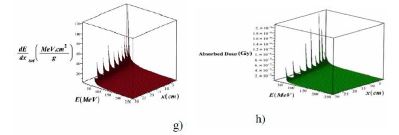
Figure 3: 3D variations of β = v/c, Barkas correction, shell correction, Lindhard-Sorensen correction, density effect, effective atomic number, total stopping power and absorbed dose, in terms of proton beam energy in the range of 1E(MeV)=250 and the penetration depth in the lung tissue in the range of 1=x(cm)=30 without the injection of metal nanoparticles (using Equation 3)
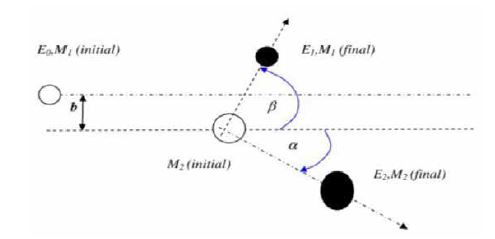
Figure 4: A plan indicating an ion with mass M1 and initial energy E0 that collides to an atom with the mass of M2 and causes it to move with energy E2 and to reduce its E1 energy
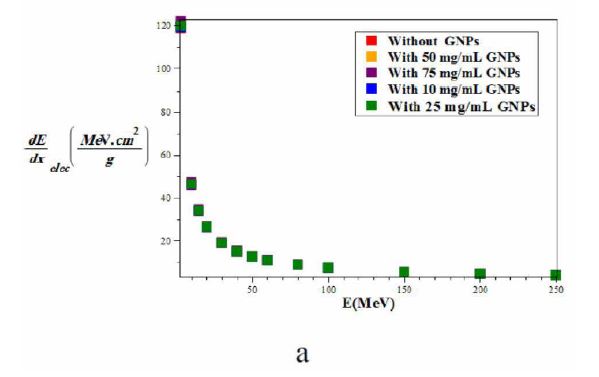
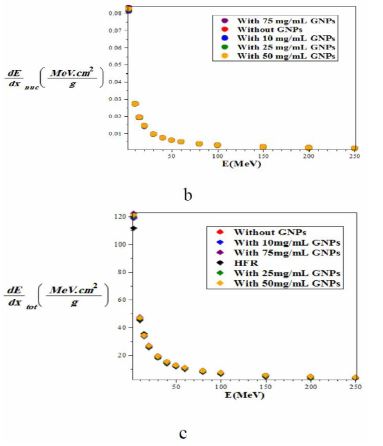
Figure 5: Comparison of the mass-stopping power a) electronic b) nuclear c) total of proton with and without injection of gold nanoparticles with different concentrations in the lung phantom and comparison with the Hartree-Fock-Roothaan (HFR) [37] atomic wave function model without Injection of gold nanoparticles using the GATE7 / GEANT4 simulation From the observation and comparison of the graphs shown in Fig. 5, the minimum of stopping power in all three cases of nuclear, electronic and total, is related to without nanoparticles of gold. By increasing the concentration of gold nanoparticles, the amount of all type of the stopping power gradually and slightly increases
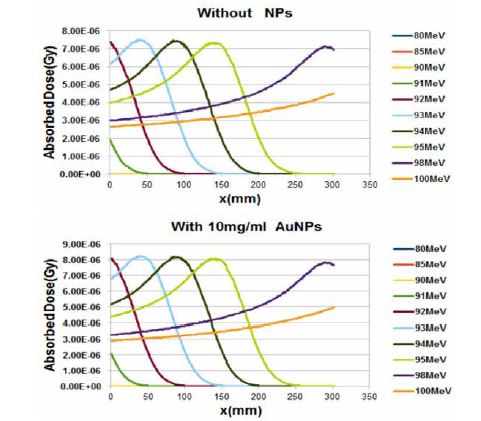
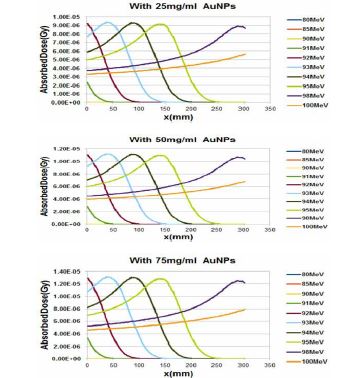
Figure 6: Comparison of the absorbed dose in the lung phantom with or without the injection of gold nanoparticles in terms of penetration depth for various proton energy (gold nanoparticles are considered as a sphere with a diameter of 50 nm and for this calculation we use GATE7 / GEANT4 simulation)
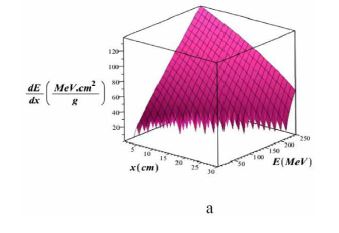
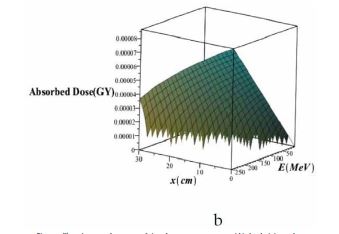
Figure 7: Three-dimensional variations of a) total mass stopping power and b) absorbed dose in lung tissue without injection of gold nanoparticles using Bragg-Kleemaan law in terms of proton energy in the range of 1=E(MeV)=250 And the penetration depth in the lung tissue in the range of 1=x(cm)=30
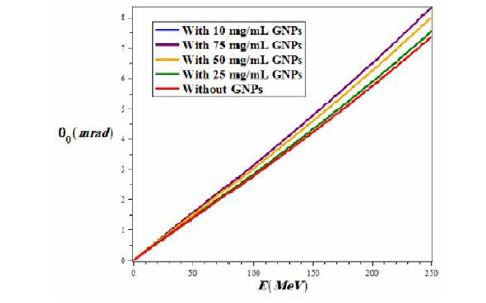
Figure 8: The variations of the mean Coulomb scattering angle in terms of proton energy in the range of 1=E(MeV)=250 for with and without the injection of different concentrations of gold nanoparticles in the lung phantom.
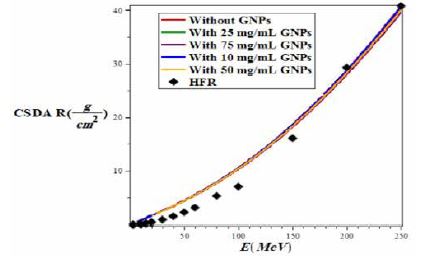
Figure 9: Variations of CSDA proton in lung tissue with and without injection of gold nanoparticles using GEANT4 / GATE7 simulation based on the energy of the proton beam in the range of 1=E(MeV)=250 and the penetration depth in the range of 1=x(cm)=30 and compare it with the model of Hartree-Fock-Roothaan (HFR) wave functions[37]
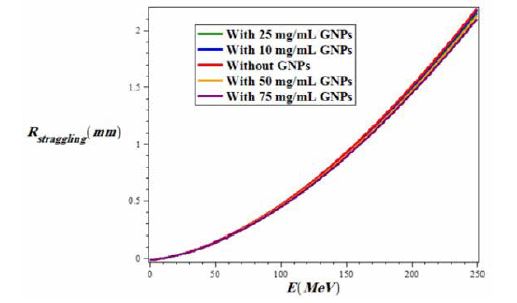
Figure 10: variations of proton range straggling in lung tissue for two states of with and without injection of gold nanoparticles using GEANT4 / GATE7 simulation versus the energy of a proton beam in the range of 1=E(MeV)=250 and the penetration depth in the range of 1=x(cm)=30 As shown in Fig. 10, the range straggling increases with increasing proton energy for both modes of with and without the injection of gold nanoparticles, but the highest range straggling is for the case of without injection of nanoparticles of gold and the lowest amount is related to injection of gold nanoparticles at a concentration of 75mg/ml. In fact, if the amount of injection of gold nanoparticles is more and more, the straggling range decreases.
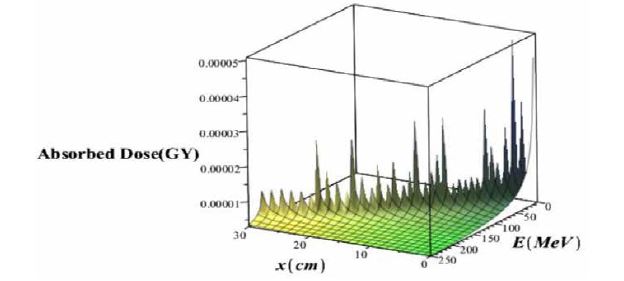
Figure 11: Three-dimensional variations of the deep dose without considering the effects of the proton straggling range in terms of the penetration depth and energy of the proton beam
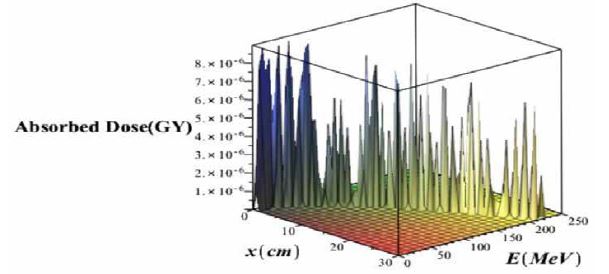
Figure 12: Three Dimensional variations of absorbed dose with considering effects of proton straggling range versus the penetration depth and energy of the proton beam without injection of gold nanoparticles
Tables at a glance
Figures at a glance