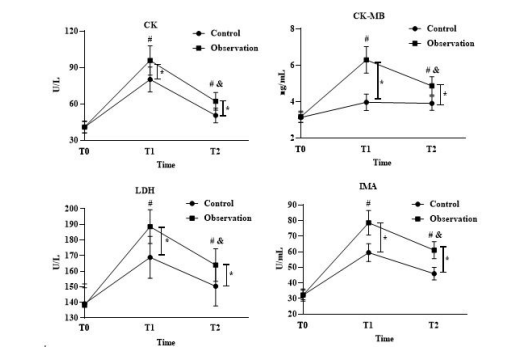
Figure 1: Comparison of myocardial enzyme indexes of both groups. * P < 0.05, compared with the CG; # P < 0.05, compared with T0; & P < 0.05, compared to T1
Figure 1: Comparison of myocardial enzyme indexes of both groups. * P < 0.05, compared with the CG; # P < 0.05, compared with T0; & P < 0.05, compared to T1
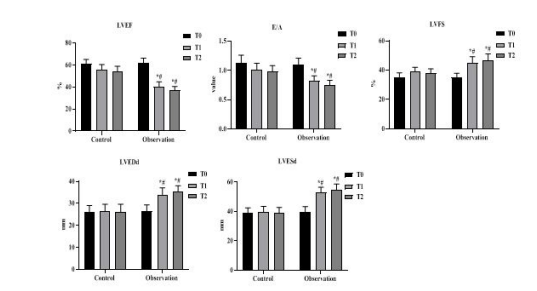
Figure 2: Comparison of echocardiographic indicators between the two groups. * P < 0.05, compared with the CG; # P < 0.05, compared to T0
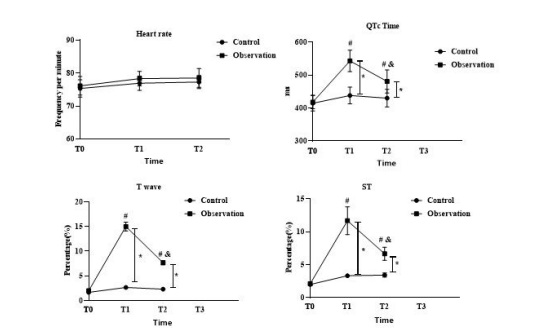
Figure 3: Comparison of electrocardiogram indexes between the two groups. *P < 0.05, compared with the CG; # P < 0.05, compared with T0; & P < 0.05, compared to T1
Tables at a glance
Figures at a glance