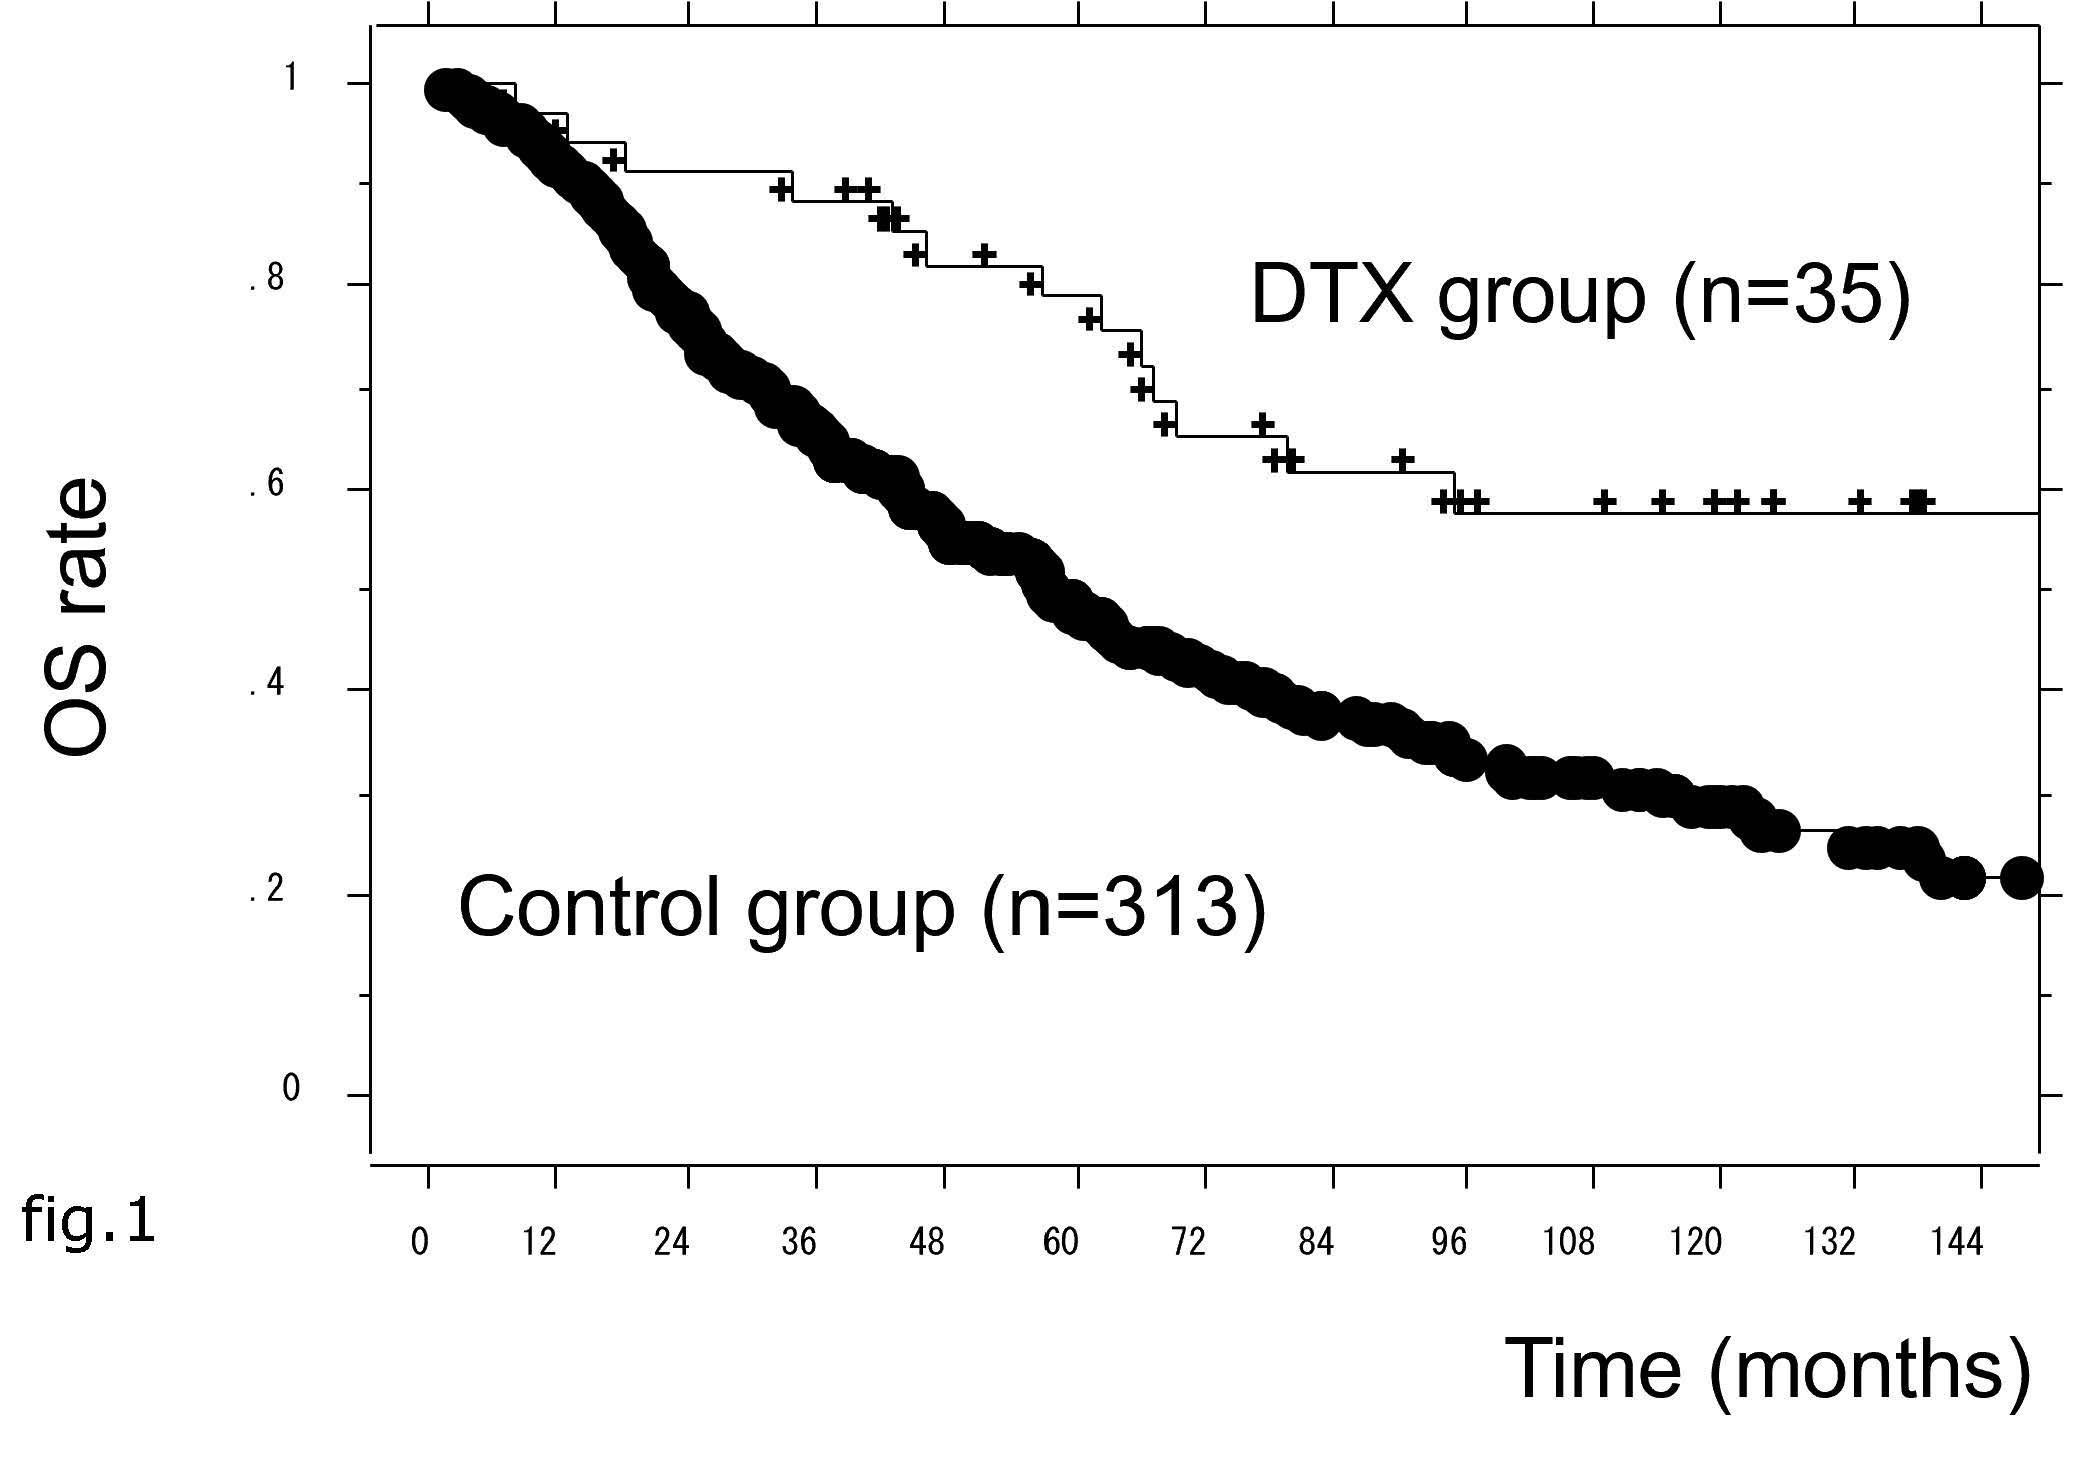
Figure 1: The prostate-specific antigen progression-free survival (PSA-PFS) in docetaxel (DTX) and control patient groups
Figure 1: The prostate-specific antigen progression-free survival (PSA-PFS) in docetaxel (DTX) and control patient groups
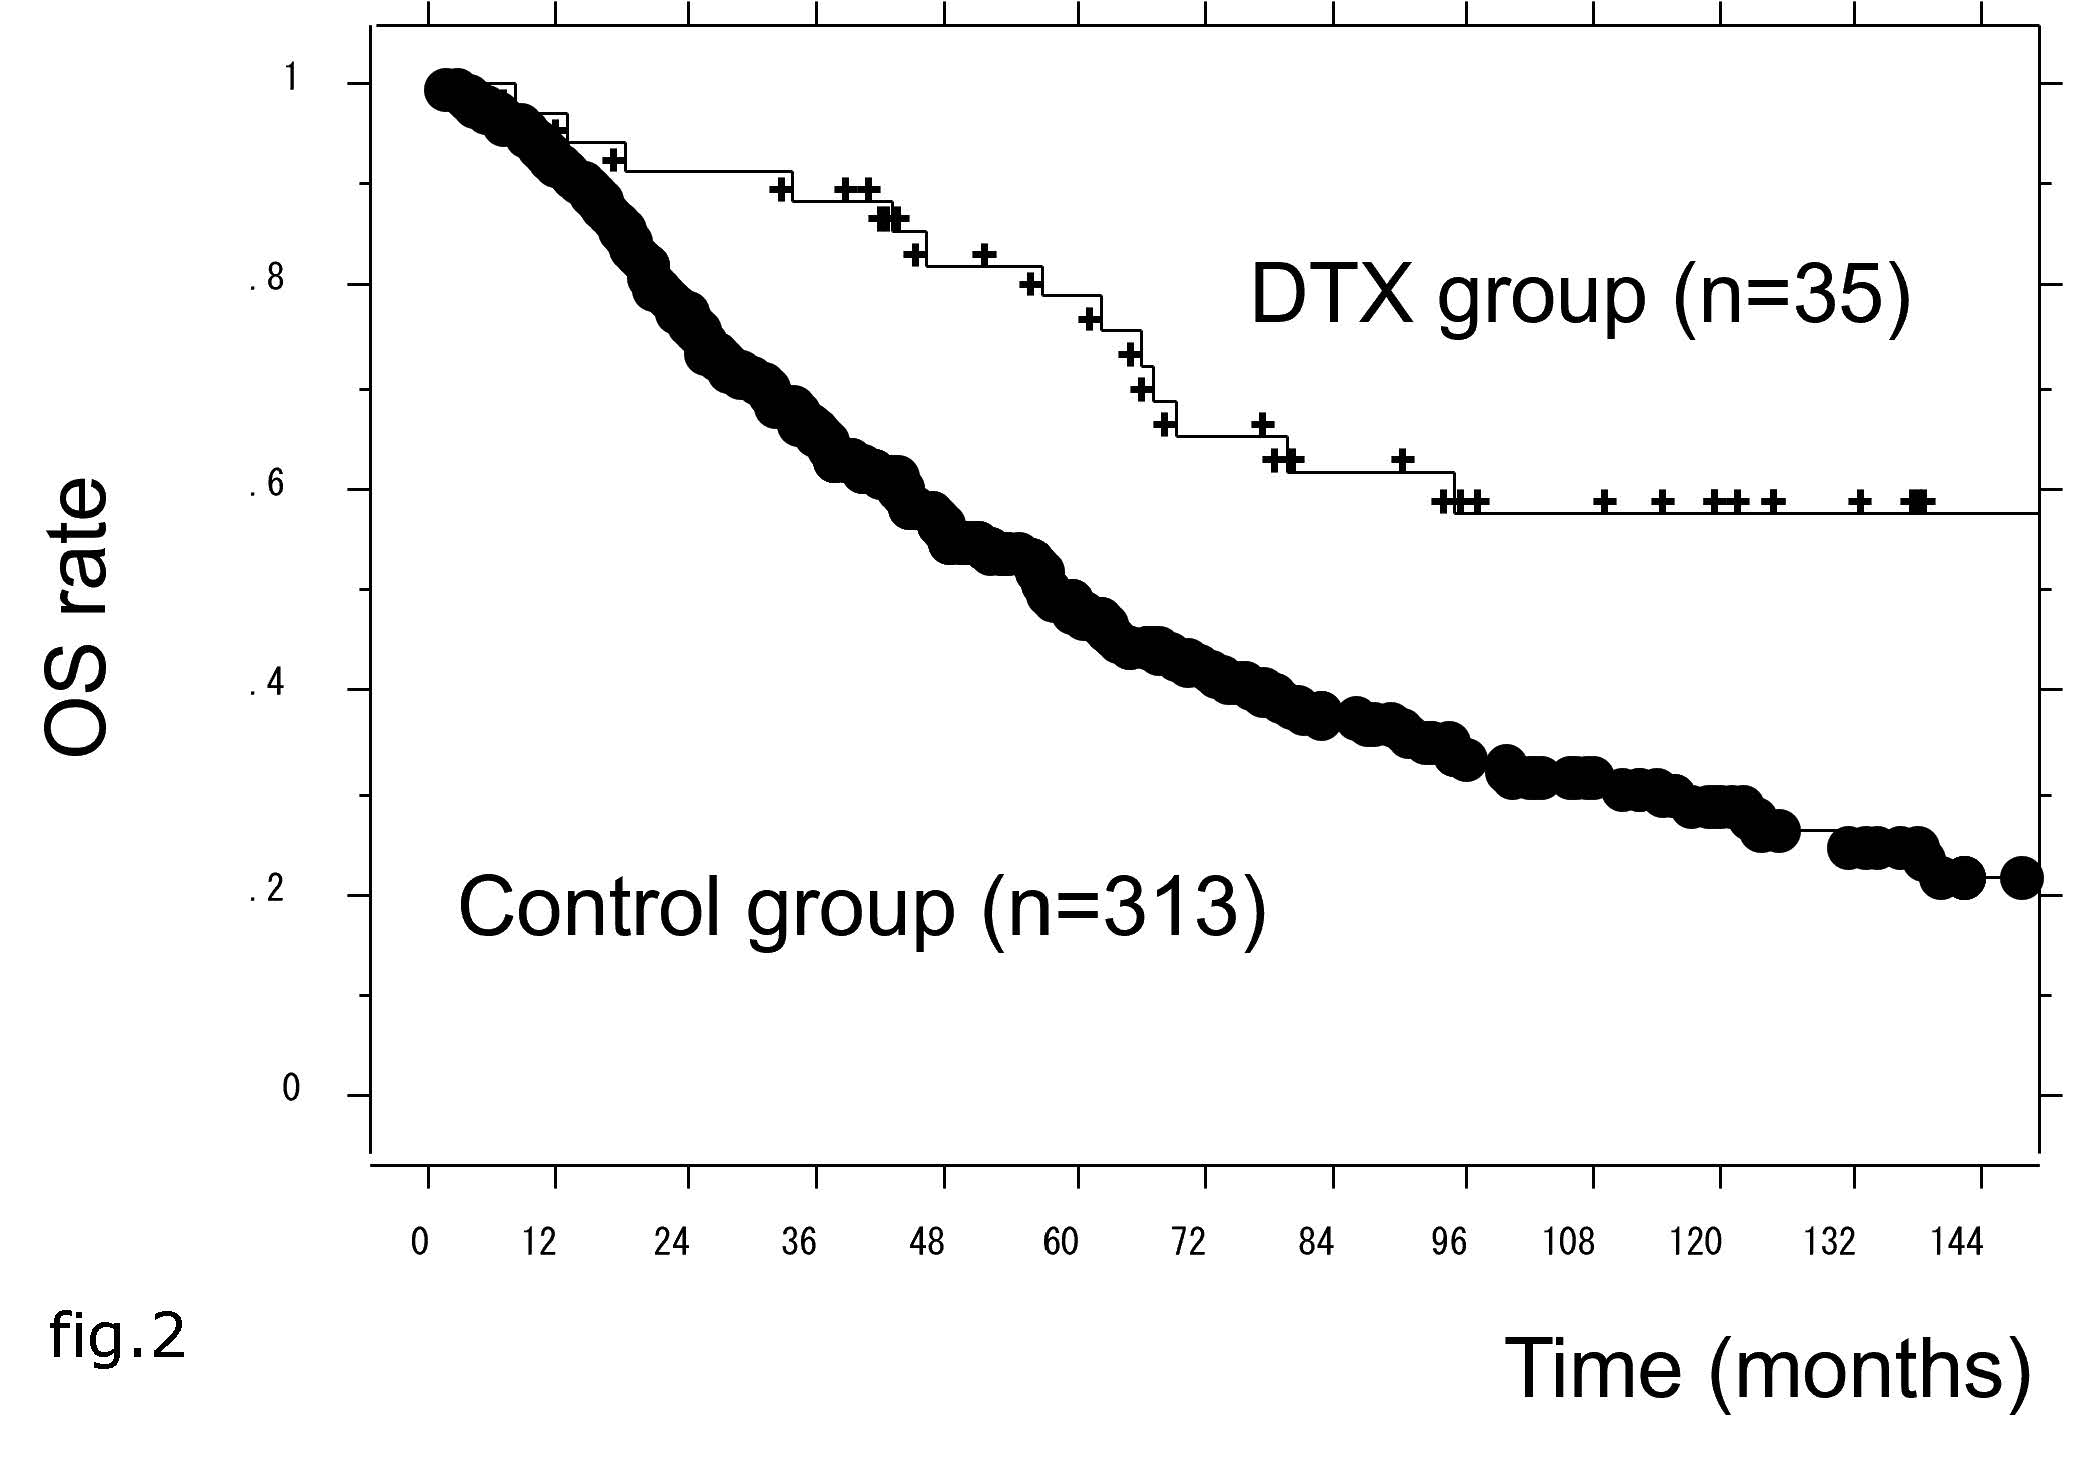
Figure 2: The overall survival (OS) rate in docetaxel (DTX) and control patient groups
.jpg)
Figure 3(a): The prostate-specific antigen progression-free survival (PSA-PFS) rate in docetaxel (DTX) and control patient groups in the low metastatic burden cohort
.jpg)
Figure 3(b): The overall survival (OS) rate in docetaxel (DTX) and control patient groups in the low metastatic burden cohort
.jpg)
Figure 4(a): The prostate-specific antigen progression-free survival (PSA-PFS) rate in docetaxel (DTX) and control patient groups in the high metastatic burden cohort
.jpg)
Figure 4(b): The overall survival (OS) rate in docetaxel (DTX) and control patient groups in the high metastatic burden cohort
Tables at a glance
Figures at a glance