TSAT <20%, serum Iron
<40 μg/dL (Protocol
Values) (A)
TSAT <30%, serum Ironvalues)(B)
Sensitivity %
67.4
67.8
Specificity %
64.5
68
Negative Predictive
Value (NPV)%
61.2
58.6
Positive Predictive
Value (PPV)%
70.67
75.9
Table : Abstract table
Table 2
Characteristic
Male (Mean±SD)
Female (Mean±SD)
No. of patients
88 (35.3%)
161 (64.6%)
Age in years
61.8 ±10.3a
54.0 ±12.4a
Hb (g/dl)
8.6 ± 0.81
8.6 ± 0.79
MCV (fl)
85.4 ± 8.0
86.3 ± 7.6
RET-He (pg/cell)
29.7 ± 5
29.8 ± 4.7
Serum Iron (µg/dl)
38.1 ± 16.1
37.8 ± 16.6
Transferrin Saturation %
15.6 ± 6.8
15.2 ± 6.4
Ferritin (ng/ml)
296.5 ± 328.2
418.8 ± 621.5
Table 1: Study population characteristics*
Table 3
RET-He Cut-off <30.4 pg
TSAT <20%, serum Iron <40 µg/dL (Protocol Values) (A)
TSAT <30%, serum Iron <40 µg/dL(In house values)(B)
Sensitivity %
67.4
67.8
Specificity %
64.5
68
Negative Predictive
Value (NPV)%
61.2
58.6
Positive Predictive
Value (PPV)%
70.67
75.9
Table 2: Gamma passing rates for the various IMRT plans and different verifications
Table 4
RET-He Cut-off
<31 pg
TSAT <20%, serum Iron <40
µg/dL (Protocol Values)(A)
TSAT <30%, serum Iron <40
µg/dL(In house values)(B)
Sensitivity %
74.1
73.8
Specificity %
60
63
Negative Predictive Value (NPV)%
64.7
61.7
Positive Predictive Value (PPV)%
70
74.8
* RET-He cut-off value established by Peerschke et al [15] Table 3: Comparative Role of RET-He <31 pg *in the evaluation of Iron Deficiency (ID) in CRA patients (n=249)
Table 5
RET-He Cut-off
<32 pg
TSAT <20%, serum Iron <40
µg/dL (Protocol Values) (A)
TSAT <30%, serum Iron <40
µg/dL(In house values)(B)
Sensitivity %
80.6
79.9
Specificity %
55.5
58
Negative Predictive
Value (NPV)%
69.3
65.9
Positive Predictive
Value (PPV)%
69.7
73.9
P value
<0.001
<0.001
* RET-He cut-off value established by Peerschke et al [15] Table 4: Comparative Role of RET-He <32* in the evaluation of Iron Deficiency (ID) in CRA patients (n=249)
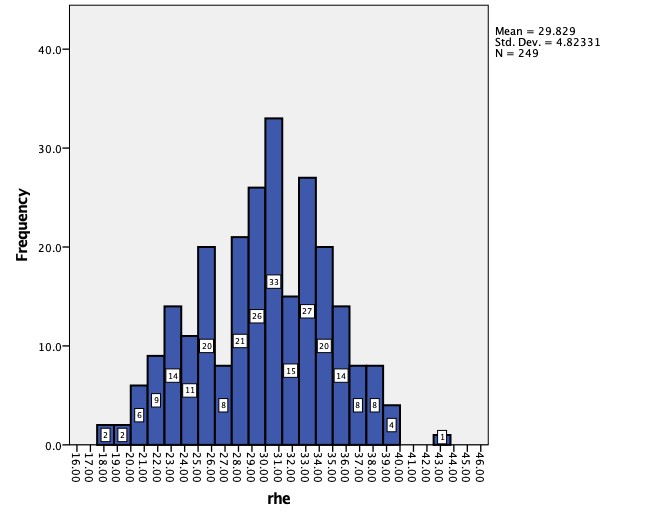
FIGURE 1
Figure 1: Distribution of RET-He
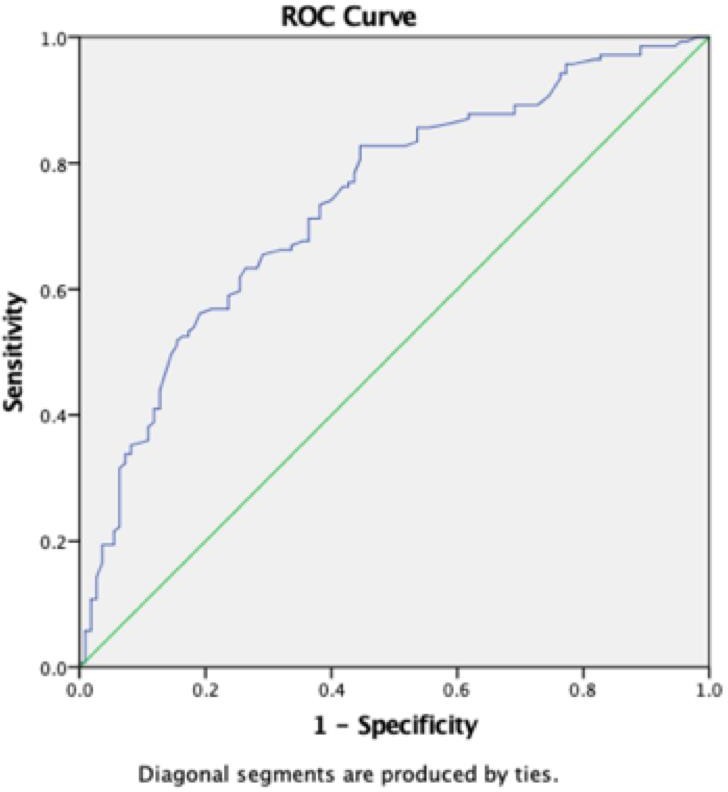
FIGURE 2
Figure 2: ROC Curve for RET-He cut-off value in CRA patients with ID (n=249)
Tables at a glance
Figures at a glance