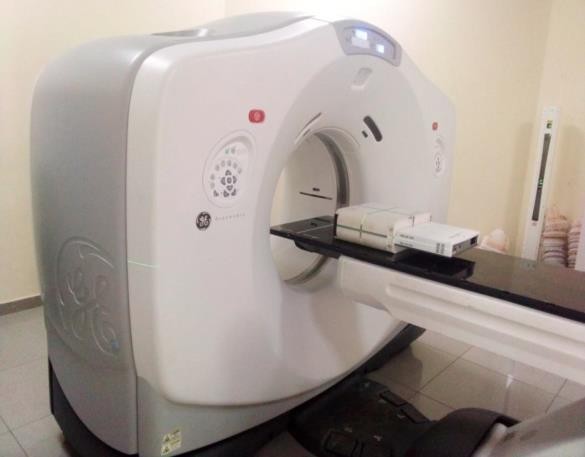
Figure 1: CT scanning of the miniPhantom with the MatriXX 2D array detector embedded in it
Figure 1: CT scanning of the miniPhantom with the MatriXX 2D array detector embedded in it
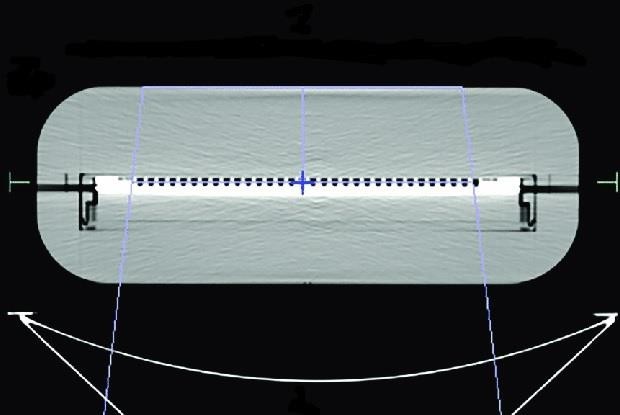
Figure 2: Axial CT slice of the miniPhantom and 2D array detector
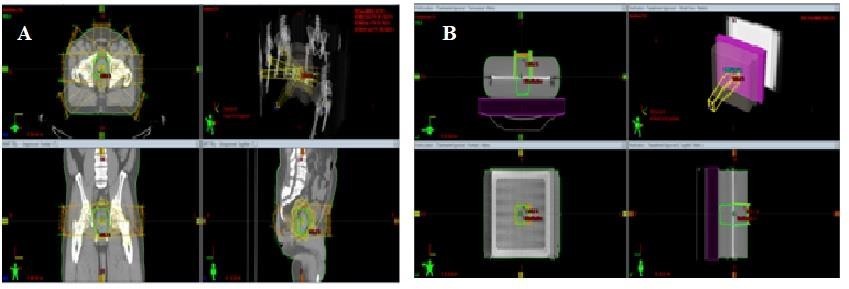
Figure 3: TPS planning window: A. prostate IMRT plan, B. Verification plan
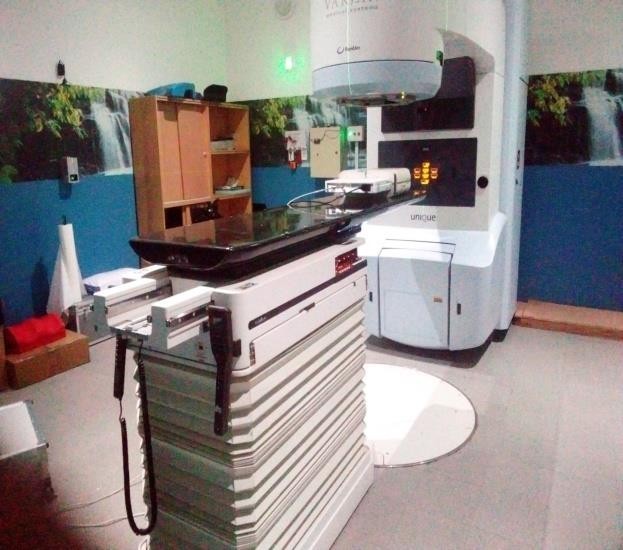
Figure 4: Treatment delivery with the miniPhantom having the MatriXX detector inserted into the phantom
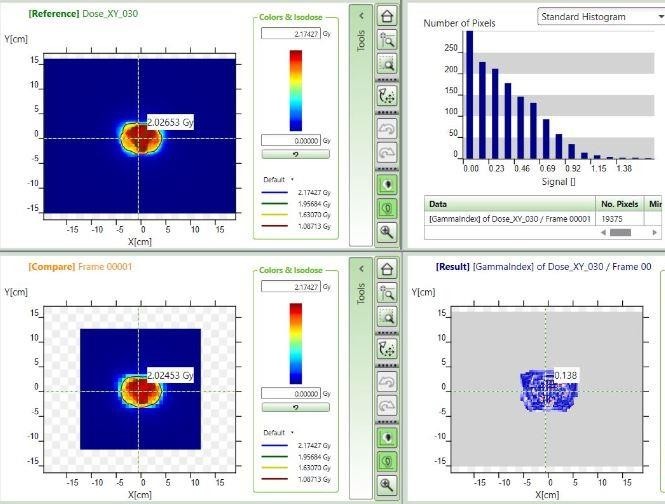
Figure 5: Dose comparison window of myQA software
.JPG)
Figure 6(a): Gamma passing rates of IMRT plans for (a) prostate
.JPG)
Figure 6(b): Gamma passing rates of IMRT plans for (b) head-and-neck cases
Tables at a glance
Figures at a glance