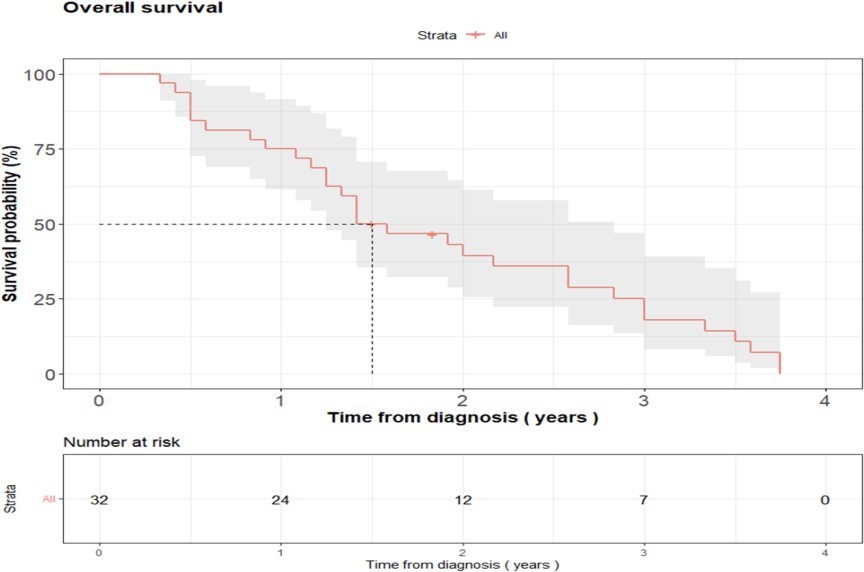
Figure 1: OS for all studied patients with metastatic RCC
|
|
N=32 |
|
Age, Mean ± SD |
62.7 ± 4.15 |
|
SEX: N(%): |
|
|
F |
6 (18.8%) |
|
M |
26(81.2%) |
|
Smoking, N (%): |
|
|
No |
18 (56.2%) |
|
Yes |
14 (43.8%) |
|
Family History, N (%): |
|
|
NO |
30 (93.8%) |
|
Unknown |
2 (6.25%) |
|
Comorbid Disease, N (%): |
|
|
COPD |
1 (3.12%) |
|
DM |
3 (9.38%) |
|
HTN |
6 (18.8%) |
|
HTN, COPD |
1 (3.12%) |
|
HTN, DM |
6 (18.8%) |
|
HTN, DM, IHD |
1 (3.12%) |
|
HTN, IHD |
2 (6.25%) |
|
No |
12 (37.5%) |
|
Pathological Type, N (%): |
|
|
Chromophobe |
1 (3.12%) |
|
Clear cell |
27 (84.4%) |
|
Medullary |
1 (3.12%) |
|
Papillary |
3 (9.38%) |
|
Stage at Presentation, N (%) |
|
|
1 |
5 (15.6%) |
|
2 |
7 (21.9%) |
|
3 |
13 (40.6%) |
|
4 |
7 (21.9%) |
|
Performance Status, N (%) |
|
|
1 |
16 (50.0%) |
|
2 |
14 (43.8%) |
|
3 |
12 (6.25%) |
Table 1 : clinic-pathological descriptive analysis of studied patients’ data
|
Treatment received, N (%): |
|
|
afinitor |
5 (15.6%) |
|
sutent |
11 (34.4%) |
|
votrient |
16 (50.0%) |
|
baseline NLR, Mean±SD |
3.17±1.07 |
|
Difference NLR (baseline and after 2 m), Mean±SD |
2.70±1.23 |
|
after 2 mon NLR, Mean±SD |
5.88±2.06 |
|
number of metastatic sites, N (%): |
|
|
1 |
20 (62.5%) |
|
2 |
11 (34.4%) |
|
3 |
1 (3.12%) |
|
organs, N (%): |
|
|
Locoregional |
1 (3.12%) |
|
liver |
6 (18.8%) |
|
liver and bone |
1 (3.12%) |
|
liver and local |
1 (3.12%) |
|
bone and locoregional |
1 (3.12%) |
|
lung |
13 (40.6%) |
|
lung and bone |
1 (3.12%) |
|
lung and brain |
1 (3.12%) |
|
lung and liver |
5 (15.6%) |
|
lung and liver and bone |
1 (3.12%) |
|
lung and local |
1 (3.12%) |
|
response to treatment after 2 months, N (%): |
|
|
PR |
19 (59.4%) |
|
progress |
6 (18.8%) |
|
SD |
7 (21.9%) |
|
Response, N (%): |
|
|
Not progressed |
26 (81.2%) |
|
Progressed |
6 (18.8%) |
|
Survival, N (%): |
|
|
Alive |
2 (6.25%) |
|
Dead |
30 (93.8%) |
Table 2: laboratory, radiological and treatment-related descriptive analysis of studied patients’ data
Figure 1: OS for all studied patients with metastatic RCC
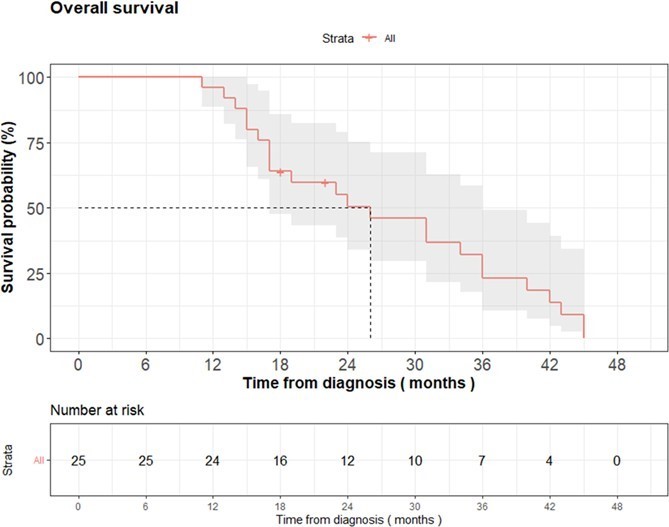
Figure 2: OS for patients presented with non-metastatic RCC
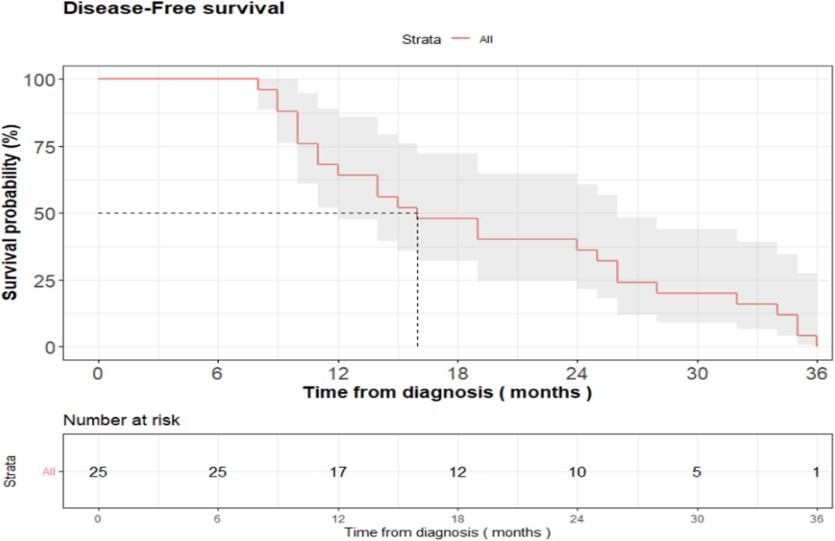
Figure 3: DFS for patient presented with non-metastatic disease
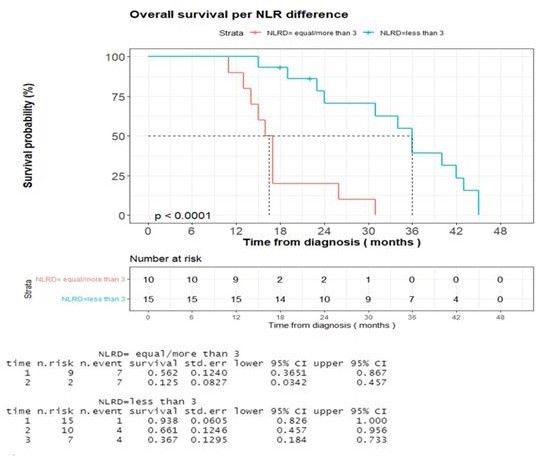
Figure 4: Impact of difference NLR between Baseline and post-treatment on OS in metastatic RCC
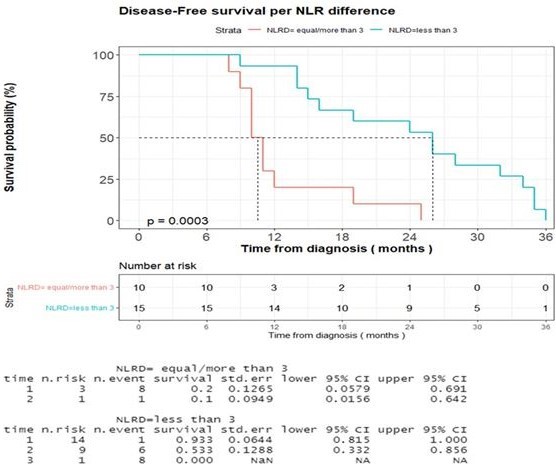
Figure 5: Impact of difference NLR between Baseline and post-treatment on DFS in previously non- metastatic RCC
Tables at a glance
Figures at a glance