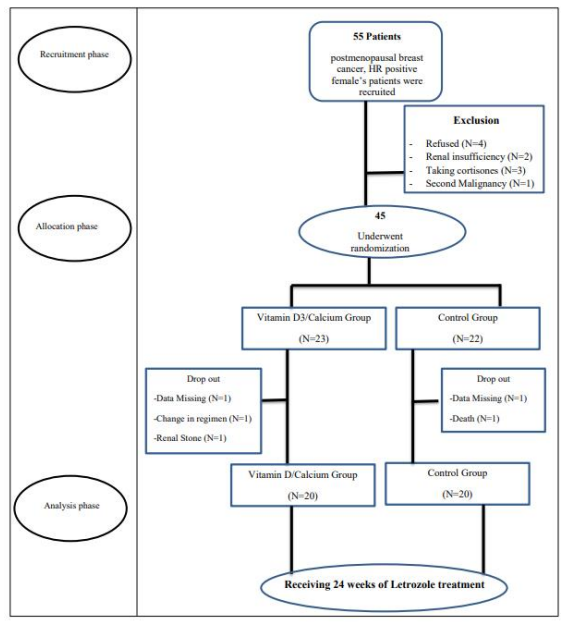
Figure 1: Flow chart of the study participants
Variables |
Groups |
T-Test |
|||||
Control Group (n=20) |
Vit D3/Ca Group(n=20) |
t |
P-value |
||||
Age (years) |
57.200 ± 4.916 |
58.500 ± 4.752 |
- 0.850 |
0.400 |
|||
Weight (Kg) |
85.850 ± 8.887 |
89.850 ± 10.989 |
-1.266 |
0.213 |
|||
Height (cm) |
160.600 ± 5.716 |
159.100 ± 5.428 |
0.851 |
0.400 |
|||
2 |
33.345 ± 3.724 |
35.534 ± 4.677 |
-1.637 |
0.110 |
|||
Ejection fraction |
59.050 ± 3.252 |
58.100 ± 2.882 |
0.978 |
0.334 |
|||
Duration of disease (weeks) |
36.400 ± 3.530 |
37.150 ± 3.297 |
-0.694 |
0.492 |
|||
Letrozole duration (Months) |
6.444 ± 1.304 |
6.080 ± 1.259 |
0.897 |
0.375 |
|||
Variables |
Group |
Chi-Square |
|||||
Control Group (n=20) |
Vit D3/Ca Group(n=20) |
||||||
N |
% |
N |
% |
2 |
P-value |
||
Stage of the disease |
Stage II |
13 |
65% |
10 |
50% |
0.921 |
0.337 |
Stage III |
7 |
35% |
10 |
50% |
|||
Estrogen receptor |
Positive |
20 |
100% |
20 |
100% |
- |
- |
Negative |
0 |
0% |
0 |
0% |
|||
Progestin receptors |
Positive |
20 |
100% |
19 |
95% |
1.026 |
0.311 |
Negative |
0 |
0% |
1 |
5% |
|||
HER2 receptors |
Positive |
4 |
20% |
5 |
25% |
0.143 |
0.705 |
Negative |
16 |
80% |
15 |
75% |
|||
HER2-positive 1HER2-positive 2FISH or ISH |
|
31-ve |
|
32-ve |
|
|
|
Types of surgery |
MRM |
18 |
90% |
19 |
95% |
0.360 |
0.548 |
BCS |
2 |
10% |
1 |
5% |
|||
Chemotherapy |
FAC |
10 |
50% |
8 |
40% |
0.404 |
0.525 |
FEC |
10 |
50% |
12 |
60% |
|||
Table 1: Anthropometric and clinical data measurements of the studied patients
Data are presented as mean ± SD, number and percentage
Control group: postmenopausal, hormone receptor positive female patients with breast cancer received Letrozole only for 24 weeks, Vit D3/- Ca group: postmenopausal, hormone receptor positive female patients with breast cancer received Letrozole in addition to 2000IU vitamin D3 and 1000mg Calcium for 24 weeks.
Kg: kilogram; cm: centimeter, BMI: body mass index, HER2: Human epidermal growth factor receptor 2, MRM: Modified radical mastecto- my, BCS; Breast conserved surgery, FAC; Fluorouracil Adriamycin cyclophosphamide, FEC: Fluorouracil Epirubicin cyclophosphamide.
P-Value: comparing control group with vit D3/Ca group at baseline (Unpaired Student t-test)
Variables |
Control group(n=20) |
Vit D3/Ca Group(n=20) |
T-Test |
|
t |
P-value |
|||
Vitamin D3 (ng/ml) |
27.280 ± 8.080 |
26.380 ± 9.245 |
0.328 |
0.745 |
Ionized Ca (mg/dl) |
4.870 ± 0.500 |
4.700 ± 0.510 |
1.064 |
0.294 |
Total Ca (mg/dl) |
9.395 ± 0.613 |
9.281 ± 0.679 |
0.560 |
0.579 |
Phosphorous (mg/dl) |
4.580 ± 0.514 |
4.550 ± 0.476 |
0.192 |
0.849 |
ALP (U/L) |
78.100 ± 22.143 |
85.900 ± 24.138 |
-1.065 |
0.294 |
Osteocalcin (ng/ml) |
29.130 ± 15.082 |
25.035 ± 17.964 |
-0.781 |
0.440 |
I-PTH (pg/ml) |
39.900 ± 21.138 |
39.500 ± 9.191 |
0.078 |
0.939 |
BMD (t-score) |
-1.935 ± 0.517 |
-1.830 ± 0.487 |
-0.661 |
0.513 |
HAQ II score |
45.450 ± 1.232 |
45.875 ± 0.943 |
1.225 |
0.228 |
Pain Score |
0.7 ± 0.58 |
0.5 ± 0.76 |
--- |
0.435 |
Table 2: Baseline biological and clinical parameters of the two study groups
Data are presented as mean ± SD
Control group: postmenopausal, hormone receptor positive female patients with breast cancer received Letrozole only for 24 weeks, Vit D3/-
Ca group: postmenopausal, hormone receptor positive female patients
with breast cancer received Letrozole in addition to 2000IU vitamin D3 and 1000mg Calcium for 24 weeks.
ng/ml; nanogram per milliliter, mg/dl: milligram per deciliter, U/L: unit per liter, I-PTH: Intact parathyroid hormone, pg/ml: pico- gram/milliliter, BMD: bone mineral density, HAQ: health assessment questionnaire.
P-Value: comparing control group with vit D3/Ca group at baseline (Unpaired student t-test)
Variables |
Control Group(n=20) |
Vit D3/Ca Group(n=20) |
||||||||
Baseline |
After 12 |
P |
After 24 Weeks |
P |
Baseline |
After 12 weeks |
P |
After 24 Weeks |
P |
|
Vitamin D3 (ng/ml) |
27.28± |
25.78 |
<0.001 |
22.97 ±7.30* |
<0.001 |
26.38±9.24 |
29.66±8.76* |
<0.001 |
33.12±7.53* |
<0.001 |
Ionized calcium (mg/dl) |
4.87 ± |
4.48 ± |
<0.001 |
4.17±0.50* |
<0.001 |
4.70±0.51 |
4.84±0.50* |
<0.001 |
5.29±0.19* |
<0.001 |
Total Calcium (mg/dl) |
9.39 ± |
8.85 ± |
<0.001 |
7.59±0.91* |
<0.001 |
9.28±0.67 |
9.55±0.47* |
0.008 |
9.90±0.24* |
<0.001 |
Phosphorous (mg/dl) |
4.58 ± |
4.05 ± |
<0.001 |
3.78±0.54* |
<0.001 |
4.55±0.47 |
4.7±0.51* |
<0.001 |
4.84±0.50* |
<0.001 |
ALP (U/L) |
78.10± |
82.55± |
<0.001 |
86.95±24.9* |
<0.001 |
85.90±24.13 |
82.90±23.46* |
0.001 |
80.30±24.33* |
<0.001 |
Osteocalcin (ng/ml) |
29.13± |
31.57± |
<0.001 |
34.22± |
<0.001 |
25.03±17.96 |
23.44±16.87* |
<0.001 |
22.43±16.61* |
<0.001 |
I-PTH |
39.9± |
45.45± |
<0.001 |
50.70±20.51* |
<0.001 |
39.50±9.19 |
37.05±8.93* |
<0.001 |
33.20±8.66* |
<0.001 |
HAQ II |
45.45± |
38.10± |
<0.001 |
24.05±0.83* |
<0.001 |
45.87±0.94 |
34.49±2.83* |
<0.001 |
18.82±2.97* |
<0.001 |
Pain Score |
0.7 ± |
4.3 ± |
<0.001 |
7.3± 0.59* |
<0.001 |
0.5±0.76 |
4.0±0.76* |
<0.001 |
6.7±0.64* |
<0.001 |
Table 3: Biological and clinical parameters of the two study groups at baseline, 3 and 6 months after intervention
Data are presented as mean ± SD
Control group: postmenopausal, hormone receptor positive female patients with breast cancer received Letrozole only for 24 weeks, Vit D3/-
Ca group: postmenopausal, hormone receptor positive female patients
with breast cancer received Letrozole in addition to 2000IU vitamin D3 and 1000mg Calcium for 24 weeks.
ng/ml; nanogram per milliliter, mg/dl: milligram per deciliter, U/L: unit per liter, I-PTH: Intact parathyroid hormone, pg/ml: pico- gram/milliliter, BMD: bone mineral density, HAQ: health assessment questionnaire.
P1-Value: comparing control group at baseline and 3 months after intervention (paired student t-test) P2-Value: comparing control group at baseline and 6 months after intervention (paired student t-test) P3-Value: comparing Vit D3/Ca group at baseline and 3 months after intervention (paired student t-test) P4-Value: comparing Vit D3/Ca group at baseline and 6 months after intervention (paired student t-test)
Variables |
After 12 weeks |
After 24 Weeks |
||||||
Control Group(n=20) |
Vit D3/Ca Group(n=20) |
T-Test |
Control Group(n=20) |
Vit D3/Ca Group(n=20) |
T-Test |
|||
t |
P |
t |
P |
|||||
Vitamin D3 (ng/ml) |
25.78±7.76 |
29.66±8.76 |
-1.479 |
0.147 |
22.97±7.30 |
33.12±7.53* |
-4.325 |
<0.001 |
Ionized calcium (mg/dl) |
4.48±0.58 |
4.84±0.50* |
-2.090 |
0.043 |
4.17±0.50 |
5.29±0.19* |
-9.222 |
<0.001 |
Total Ca (mg/dl) |
8.85±0.72 |
9.55±0.47* |
-3.591 |
0.001 |
7.59±0.91 |
9.90±0.24* |
-10.914 |
<0.001 |
Phosphorous (mg/dl) |
4.05±0.56 |
4.70±0.51* |
-3.829 |
<0.001 |
3.78±0.54 |
4.84±0.50* |
-6.434 |
<0.001 |
ALP (U/L) |
82.55±23.75 |
82.90±23.46 |
-0.047 |
0.963 |
86.95±24.90 |
80.30±24.33 |
0.854 |
0.398 |
Osteocalcin (ng/ml) |
31.57±15.81 |
23.44±16.87 |
-1.571 |
0.124 |
34.22±6.01 |
22.43±16.61* |
-2.286 |
0.28 |
Intact-PTH (pg/ml) |
45.45±20.00 |
37.05±8.93 |
1.714 |
0.095 |
50.70±20.51 |
33.20±8.66* |
3.515 |
0.001 |
HAQ II |
38.10±2.12 |
34.49±2.83* |
-4.548 |
<0.001 |
24.05±0.83 |
18.82±2.97* |
-7.573 |
<0.001 |
Pain Score |
4.3±0.85 |
4.0±0.76 |
--- |
0.558 |
7.3±0.59 |
6.7±0.64* |
--- |
0.005 |
Table 4: Comparing biological and clinical parameters of the of the two study groups 3 and 6 months after intervention
Data are presented as mean ± SD
Control group: postmenopausal, hormone receptor positive female patients with breast cancer received Letrozole only for 24 weeks, Vit D3/-
Ca group: postmenopausal, hormone receptor positive female patients
with breast cancer received Letrozole in addition to 2000IU vitamin D3 and 1000mg Calcium for 24 weeks.
ng/ml; nanogram per milliliter, mg/dl: milligram per deciliter, U/L: unit per liter, I-PTH: Intact parathyroid hormone, pg/ml: pico- gram/milliliter, BMD: bone mineral density, HAQ: health assessment questionnaire.
P5-Value: comparing control group versus vitamin D3/calcium supplementation group 3 months after intervention (Unpaired student t-test) P6-Value: comparing control group versus vitamin D3/calcium supplementation group 6 months after intervention (Unpaired student t-test)
Pearson Correlations between BMD and biological markers |
||
Vit D3/Calcium supplementation group |
t-score after 24 weeks |
|
r |
P-value |
|
Vitamin D |
* |
0.001 |
Ionized calcium |
* |
0. 001> |
Phosphorous |
* |
0. 001> |
Alkaline phosphatase (ALP) |
* |
0. 001> |
Osteocalcin |
* |
0.027 |
Intact- parathyroid hormone (I-PTH) |
* |
0. 001> |
Table 5: Pearson correlation analysis of the measured variables for vitamin D3/calcium supplementation group
Figure 1: Flow chart of the study participants
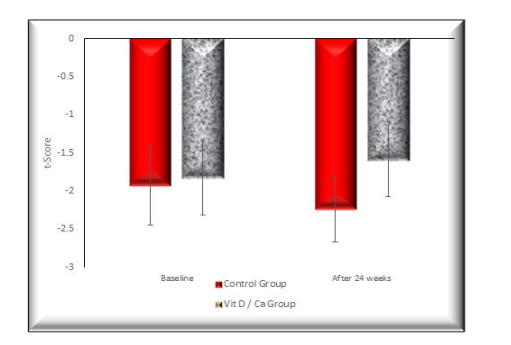
Figure 2: Bone mineral density for the two study groups
Control group: postmenopausal, hormone receptor positive female patients with breast cancer received Letrozole only for 24 weeks, Vit D3/-
Ca group: postmenopausal, hormone receptor positive female patients
with breast cancer received Letrozole in addition to 2000IU vitamin D3 and 1000mg Calcium for 24 weeks.
Tables at a glance
Figures at a glance