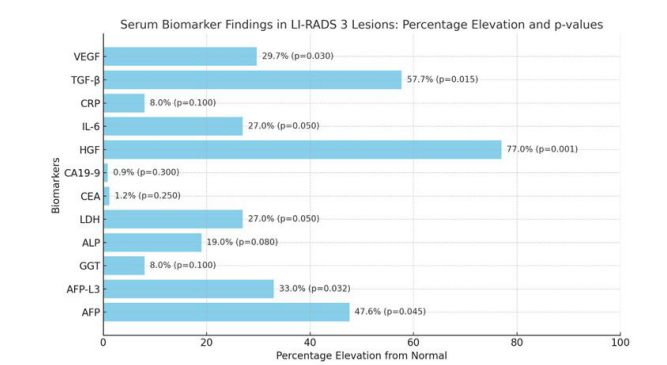
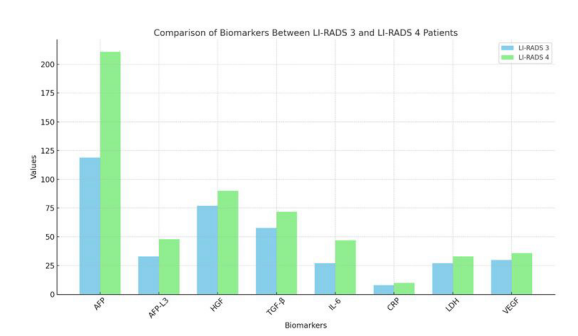
Figure 1: This figure illustrates the percentage elevation of various serum biomarkers in patients with LI-RADS 3 lesions. Each bar represents the percentage by which a specific biomarker is elevated compared to normal levels, and the associated p-values are displayed alongside the percentages. These p-values indicate the statistical significance of the differences observed, with lower p-values suggesting stronger evidence for the observed differences. For example, HGF shows the highest elevation at 77%, with a p-value of 0.001, indicating a strong association with LI-RADS 3 lesions. AFP also shows a significant elevation at 47.61%, with a p-value of 0.045, suggesting its potential role in identifying higher-risk patients. Biomarkers like CEA and CA19-9 show smaller percentage elevations and higher p-values, reflecting their lower diagnostic value in this cohort.This analysis can guide further investigation into the biomarkers most indicative of malignant transformation in LI-RADS 3 patients.
Tables at a glance
Figures at a glance