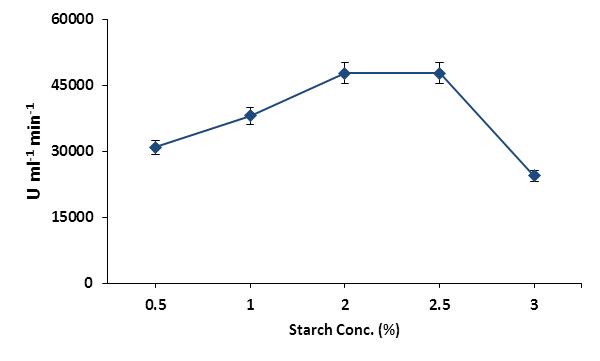
Figure 1: Effect of substrate concentration on the activity of human salivary a-amylase (meansą S.E., n = 6)
Figure 1: Effect of substrate concentration on the activity of human salivary a-amylase (meansą S.E., n = 6)
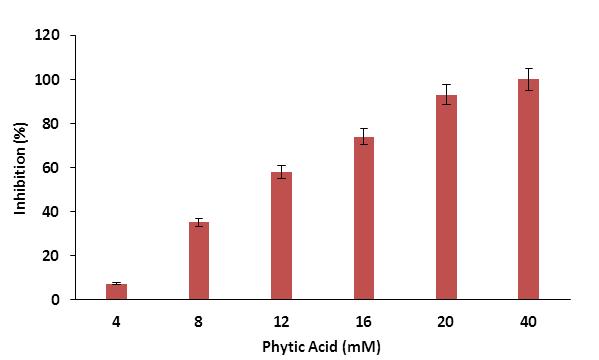
Figure 2: Effect of phytic acid concentration on the activity of human salivary a-amylase (meansą S.E., n = 6)
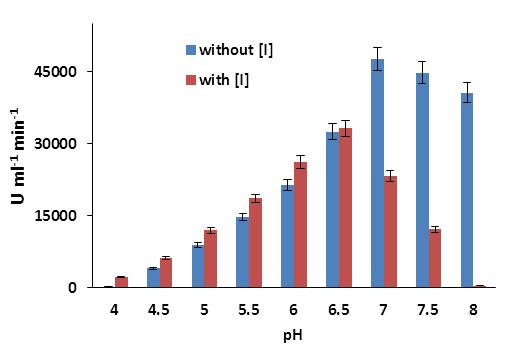
Figure 3: Effect of pH on the inhibition activity of phytic acid to human salivary a-amylase (meansą S.E., n = 6)
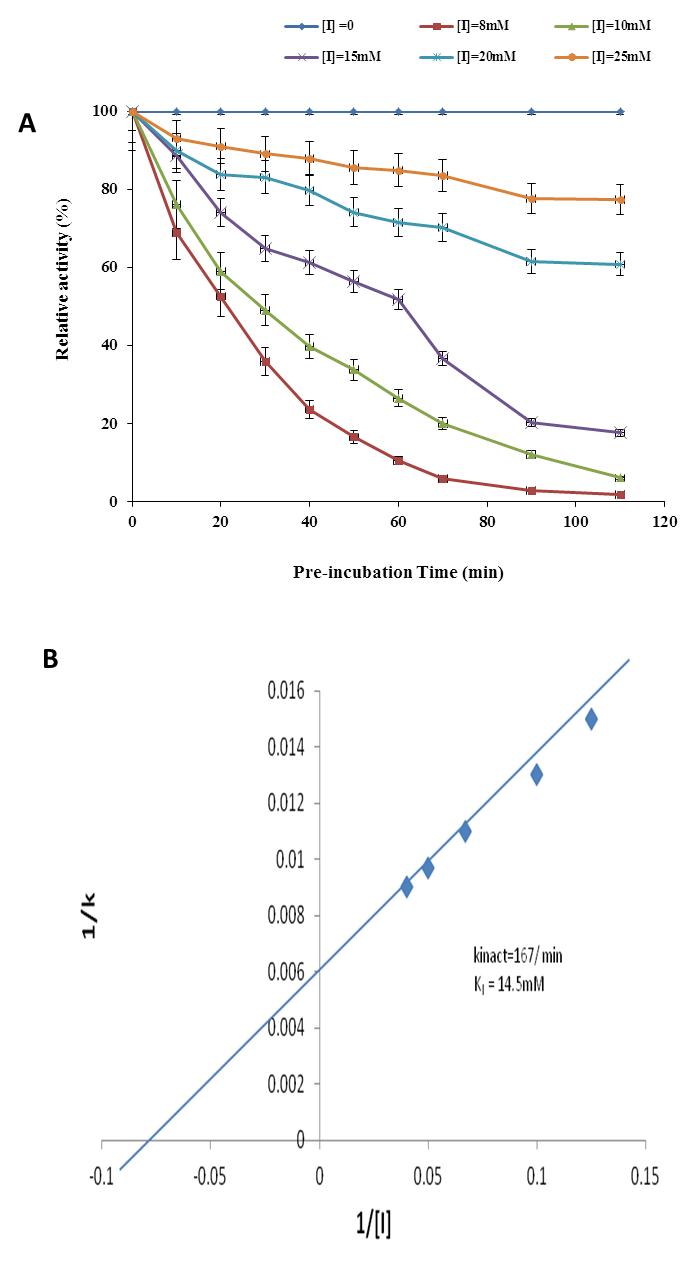
Figure 4: Kitz and Wilson plot of inactivation of human salivary a-amylase during pre-incubation with phytic acid at pH 7.0, 370C. (A)a-amylase activity vs. pre-incubation time(meansą S.E., n = 6).(B) Apparent rate of inactivation (Kapp) vs. inhibitor concentration (meansą S.E., n = 6)
Figure 5: Effect of phyticacid on the Km and Vmax of human salivary a-amylase (meansą S.E., n = 6)
Figures at a glance