
Parameter(%) |
Colocasiaesculenta |
Brachystegiaeurycoma |
Crude Protein |
|
|
Crude Fibre |
|
|
Moisture Content |
|
|
Fat Content |
|
|
Ash |
|
|
Carbohydrate |
|
|
Table 1: Result of Proximate Analysis of the samples
Values show means of triplicate analysis ± standard deviation. Figures with different superscript across the rows are significantly different at (p= 0.05).
Parameters |
Colocasiaesculenta |
Brachystegiaeurycoma |
Flavonoids |
+ |
++ |
Alkaloids |
+++ |
– |
Saponins |
– |
+ |
Tannins |
+ |
– |
Protein |
++ |
++ |
Terpenoids |
+++ |
++ |
Phenol |
+ |
+ |
Steroids |
+++ |
+++ |
Cardiac glycoside |
– |
++ |
Reducing sugar |
+ |
+ |
Anthraquinones |
– |
+ |
Table 2: Qualitative Phytochemical Screening Results
KEY: +++ Significantly present, ++ moderately present, + weakly present, - absent
Parameters |
Colocasiaesculenta |
Brachystegiaeurycoma |
Flavonoids |
|
|
Alkaloids |
|
|
Saponins |
|
|
Tannins |
|
|
Protein |
|
|
Terpenoids |
|
|
Phenol |
|
|
Steroids |
|
|
Cardiac glycoside |
|
|
Reducing sugar |
|
|
Anthraquinones |
|
|
Values show means of triplicate analysis ± standard deviation. Figures with different superscript across the rows are significantly different at (p = 0.05).
Table 3: Quantitative Phytochemical Screening Results in mg/100g
Values show means of triplicate analysis ± standard deviation. Figures with different superscript across the rows are significantly different at (p= 0.05).
Parameter |
Colocasiaesculenta |
Brachystegiaeurycoma |
Ascorbic acid (Vitamin C) |
|
|
Niacin (Vitamin B3) |
|
|
Riboflavin (Vitamin B2) |
|
|
Thiamine (Vitamin B1) |
|
|
Table 4: Vitamin Contents of Soup Thickeners in mg/100g
Values show means of triplicate analysis ± standard deviation. Figures with different superscript across the rows are significantly different at (p= 0.05).
Colocasiaesculenta |
Brachystegiaeurycoma |
|||
Element |
Atomic Conc. |
WeightConc. |
AtomicConc. |
Weight Conc. |
C |
72.97 |
66.16 |
79.60 |
73.47 |
N |
23.72 |
25.08 |
17.22 |
18.54 |
Si |
0.14 |
0.30 |
0.15 |
0.33 |
Fe |
0.25 |
1.04 |
-. |
- |
Ca |
0.18 |
0.54 |
1.02 |
3.14 |
Ti |
0.12 |
0.44 |
0.13 |
0.46 |
Al |
0.34 |
0.70 |
0.34 |
0.71 |
K |
1.05 |
3.10 |
- |
- |
P |
0.31 |
0.72 |
0.35 |
0.83 |
Na |
0.32 |
0.56 |
0.32 |
0.56 |
S |
0.19 |
0.47 |
0.36 |
0.89 |
Mg |
0.24 |
0.43 |
0.40 |
0.76 |
Cl |
0.17 |
0.46 |
0.12 |
0.32 |
Table 5: EDX elemental composition of the phyto-synthesized nanoparticles
RT (min) |
Compound |
Molecular Formula |
|
Peak Area % |
25.57 |
Eicosene, (E)- |
C20H40 |
280 |
2.12 |
29.68 |
n-hexadecanoic acid |
C16 H32 O2 |
256 |
17.58 |
33.14 |
9,17-Octadecadienal, (Z)- |
C18 H32 O |
264 |
16.67 |
34.73 |
Oleic acid |
C16 H34 O2 |
282 |
10.25 |
35.85 |
Octadecanal |
C18 H36 O |
268 |
48.18 |
38.85 |
17-pentatriacontene |
C35 H70 |
490 |
5.20 |
Table 6: GC-MS Results of Brachystegia eurycoma
RT (min) |
Compound |
Molecular Formula |
|
Peak Area % |
10.85 |
Benzoic acid |
C 7 H6 O2 |
122 |
15.89 |
19.09 |
Butylated hydroxytoluene |
C15 H24 O |
220 |
51.64 |
23.47 |
Heptadecane |
C17 H36 |
240 |
6.45 |
25.62 |
9-eicosene, (E)- |
C20 H40 |
280 |
5.86 |
36.45 |
1-hexacosene |
C26 H52 |
364 |
20.16 |
Table 7: GC-MS Results of Colocasia esculenta
Sample |
Average particle size (nm) |
|
Colocasiaesculenta |
81.83 |
42.89 |
Brahystegiaeurycoma |
70.38 |
35.79 |
Table 8: Particle size and area of the phyto-synthesized nanoparticles of the samples
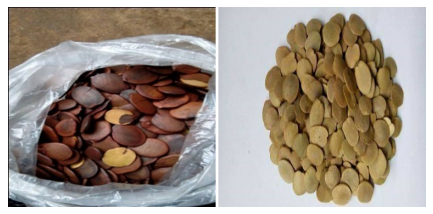
Figure 1: Brachystegia eurycoma (achi) seeds
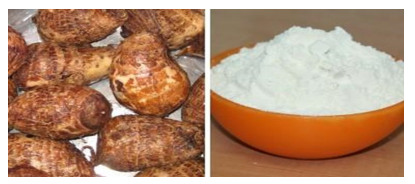
Figure 2: Colocasia esculenta (L.) Schott corms and flour
Figure 3: GC-MS Chromatogram of B. eurycoma extracts
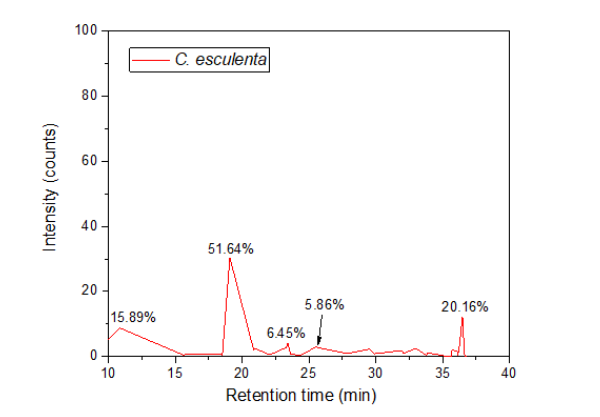
Figure 4: GC-MS Chromatogram of C. esculenta extract
Figure 5: Scanning Electron Microscopy images of iron-synthesized nanoparticles using Colocasia esculenta (ede) and Brachstegia eurycoma (achi) extracts with their respective histograms showing particle size distribution
Tables at a glance
Figures at a glance