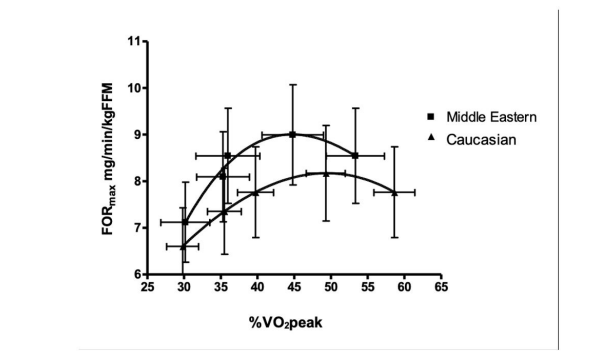
Figure 1: Fat-oxidation rate curves of both participant groups plotted at 5%, 10%, and 20% below FORmax
Characteristics |
C |
ME |
P-value |
Age (yrs) |
57.1± 3.3 |
52.6 ± 2.8 |
0.04 |
Age of First Cycle (yrs) |
12.2 ± 8.2 |
13.3 ± 1.1 |
0.023 |
Age of Last Cycle (yrs) |
51.1 ± 2.6 |
46.5 ± 5.7 |
0.031 |
Menstrual Age (yrs) |
39.0 ± 2.2 |
32.2 ± 5.6 |
0.007 |
Height (cm) |
161.5 ± 4.6 |
162.2 ± 5.9 |
- |
Body mass (kg) |
71.0 ± 12.1 |
84.0 ± 16.7 |
0.027 |
BMI |
27.0 ± 3.8 |
31.8 ± 5.9 |
0.032 |
NIH Waist Circumference (cm) |
90. 9 ± 11.0 |
106.1 ± 11.2 |
0.05 |
Sum of 5 Skinfolds (mm) |
107.5 ± 35.6 |
136.1 ± 49.3 |
- |
Tanita Body Fat Scale (%) |
37.0 ± 5.4 |
41.7 ± 6.4 |
- |
Resting Blood Pressure (mmHg) |
109/72 ± 12/11 |
114/72 ± 13/9 |
- |
Resting Heart Rate (bpm) |
67 ± 7.2 |
72 ± 12 |
- |
Resting VO2 Absolute (LO2·min-1) |
0.26 ± 0.09 |
0.33 ± 0.05 |
- |
VO2 peak Absolute (LO2·min-1) |
1.98 ± 0.3 |
1.78 ± 0.3 |
- |
Peak Heart Rate (bpm) |
164 ± 9 |
158 ± 10 |
- |
Table 1: Comparison of Maximum Inspiratory Pressure Values in Obese, Over Weight, Normal Weight Adult Female
Characteristics |
C |
ME |
Estradiol (pmol/L) |
84.93 ± 31.38 |
71.27 ± 4.55 |
Estrone (pmol/L) |
138.25 ± 65.45 |
155.00 ± 52.74 |
Progesterone (nmol/L) |
1.08 ± 0.29 |
1.36 ± 0.68 |
Testosterone (nmol/L) |
1.33 ± 0.60 |
1.12 ± 0.63 |
Follicular Stimulating Hormone (IU/L) |
85.0 ± 26.9 |
68.6 ± 28.9 |
Luteinizing Hormone (IU/L) |
38.8 ± 12.3 |
33.4 ± 11.2 |
Sex Hormone-Binding Globulin (nmol/L) |
45.04 ± 15.96 |
43.84 ± 21.91 |
Androgen Index |
0.213 ± 0.131 |
0.146 ± 0.118 |
Cortisol (nmol/L) |
215.58 ± 113.88 |
190.09 ± 100.50 |
Insulin (pmol/L) |
46.08 ± 20.81 |
64.90 ± 50.98 |
Fasting Glucose (nmol/L) |
5.33 ± 0.49 |
5.39 ± 0.80 |
Total Cholesterol (nmol/L) |
5.53 ± 1.32 |
5.08 ± 1.21 |
LDL (nmol/L) |
3.42 ± 1.15 |
3.12 ± 0.78 |
HDL (nmol/L) |
1.57 ± 0.35 |
1.28 ± 0.57 |
CH/LDL (nmol/L) |
3.69 ± 1.16 |
3.98 ± 1.03 |
Triglyceride (nmol/L) |
1.21 ± 0.61 |
1.33 ± 0.64 |
No significant differences were not detected between the two groups, indicating that there are no hormonal variations between these two ethnicities.A complete blood sample was not available for 1 participant in the ME group
Table 2: Blood Test Results of the Study Participants
Figure 1: Fat-oxidation rate curves of both participant groups plotted at 5%, 10%, and 20% below FORmax
Tables at a glance
Figures at a glance