Spontaneous Physical Activity Associates with Higher Adiponectin/ Myostatin Ratio and Lower Cardiometabolic Risk in Argentinean Children with Obesity and A Parental History of Metabolic Syndrome
Received Date: March 01, 2022 Accepted Date: March 31, 2022 Published Date: April 01 , 2022
doi: 10.17303/jomd.2022.1.102
Citation: Zelmira Guntsche (2022) Spontaneous Physical Activity Associates with Higher Adiponectin/ Myostatin Ratio and Lower Cardiometabolic Risk in Argentinean Children with Obesity and A Parental History of Metabolic Syndrome. J Obes Metab Dis 2: 1-15
Abstract
Background: The association of spontaneous mil-to-moderate physical activity with glucose tolerance in children has not been clearly demonstrated.
Objective: we aimed to assess the association of sedentarism and different levels of physical activity with glucose metabolism alterations in pediatric obesity.
Methods: We studied 78 pediatric patients referred to our center with obesity and at least one parent having the metabolic syndrome, divided into quartiles of weekly physical activity, according to a seven-day recall questionary. The first quartile included children who performed less than 4 h of weekly activity, the second, children with 4 to 8 h, the third, children with 8 to 14 h of weekly activity and the fourth quartile, children who did more than 14 h a week. We analyzed fasting samples for glucose, insulin, adiponectin, and myostatin. We performed oral glucose tolerance tests for whole-body, muscle and hepatic insulin sensitivity, oral-glucose disposition index, and dual X-ray absorptiometry for body composition.
Results: We found that more active patients in the upper quartile had lower blood pressure, lower trunk adiposity, and higher lean appendicular mass. In contrast, patients in the lower quartile showed higher fasting and two-hour glycemia, lower whole body, muscle and hepatic insulin sensitivity, lower oral-glucose disposition index, lower adiponectin, and increased myostatin levels. An adiponectin/myostatin ratio cut-off of <43.5 identified patients likely to have glucose alterations (ROC: 0.70, p<0.01). The probability of having glucose metabolism disturbances, whether impaired fasting glucose, glucose intolerance or diabetes, was higher in patients within the lower quartile of weekly physical activity (OR:8.87; p <0.002).
Conclusions: Our findings indicate that, in pediatric patients with obesity, the decrease of sedentary time and the development of not only scheduled but spontaneous mild-to-moderate physical activity, such as walking or playing outdoors, may have a role in preventing glucose metabolism alterations and type 2 diabetes.
Keywords: Sedentarism; Obesity; Children; Diabetes; Adiponectin; Myostatin
Introduction
Obesity in the pediatric age is one of the crucial health problems of the 21st century that displays an increasing prevalence, even in the low-income regions of Latin America. Its complications appear early in children with a family history of diabetes, hypertension, or metabolic syndrome [1-5] and progress quickly in adolescents [6,7]. An increase of adipose tissue with altered compartmentalization (8), ectopic fat cluster, metabolic syndrome [2,9–12], hepatic steatosis [13,14], alteration of adipokines levels and markers of inflammation [10,15,16] constitutes a risk phenotype [17]. Moreover, in the pediatric age a sedentary lifestyle has emerged as one important risk factor, independent of the amount of physical activity performed [18], and this has been evident during COVID-19 pandemic lockdown [19]. A systematic review [20,21] concluded that sedentarism is associated in a dose-dependent manner with an increased cardiovascular risk, components of the metabolic syndrome, impaired body composition, and low self-esteem with decreased academic performance; however, its relationship to blood glucose disturbances in children and adolescents with obesity has not been well established. Sedentarism appears to be related to variations in the levels of myokines [22] produced by muscle tissue according to its state of contractility and inflammation [23], and an alteration of metabolic flexibility, such as the body´s capacity to adapt the oxidation of substrates to variations in their availability and energy demand [24]. Furthermore, a sedentary lifestyle is accompanied by metabolic inflexibility, increased dependence on glucose as an energy substrate, and lower lipid oxidation, favoring the ectopic deposit of fat, insulin resistance, and glucose intolerance [25].
On the other hand, the benefits of physical activity on cardiovascular risk in adults is widely known, including its ability to prevent the development of type 2 diabetes [26,27] but this fact has not been clearly demonstrated in the pediatric population [28]. In adolescents with type 2 diabetes, the glycemic response to lifestyle changes is scarce [29,30], and low adiponectin predicts early therapeutic failure with early insulin requirements [31].
The present work aims to assess the association of a sedentary lifestyle and different levels of physical activity with several pediatric health indicators, with an emphasis on glucose metabolism and diabetes risk in children with obesity. For this, we analyzed the differences in body composition, insulin sensitivity, oral-glucose disposition index, and plasma levels of fat and muscle signaling molecules in obese children from Argentina with a parental history of metabolic syndrome.
Methods
Population
The study was conducted in the Endocrinology Service of Humberto Notti´s Pediatric Hospital from Mendoza, Argentina, between July 2018 and June 2019. We included a random sample of patients referred to our center for obesity treatment, age 5 to 15 years, who had one or both parents with trunk adiposity and two of the other components of the metabolic syndrome (hypertension or permanently taking drugs for lowering blood pressure, glycemia greater than 5.5 mmol/L, HDL-cholesterol lower than 1.03 mmol/L in men or 1.29 mmol/L in women, or triglycerides higher than 1.7 mmol/L). Out of a total of 293 patients evaluated, 78 met the inclusion criteria and were enrolled into the study. This number was expected given the prevalence of 27 % of metabolic syndrome in our adult population and it was similar to the sample size obtained by the formula for hypothesis tests and mean comparison:n=2(Zα+Zβ)2.S2/d2=72, considering Za: 1.96, Zβ:1.645, a standardized effect size d = 0.3 mmol/L and a variance S of 0.5 mmol/L for post-load glycemia based on previous data in our center. We selected children aged 5 to 15 years because scheduled physical activity starts from 5 years old in our country. Children with secondary obesity and those who developed an acute intercurrent disease or received treatments capable of altering insulin sensitivity in the previous three months were excluded.
Clinical variables
We recorded: age, sex, age at obesity onset, stage of pubertal development (prepubertal Tanner 1 and pubertal Tanner [2-5], BMI z-score according to the World Health Organization (https://www.who.int/growthref/tools/en/), blood pressure percentiles for age, height and sex according to the TASK Force Tables [32]. Based on a previously validated seven-day recall questionary [33], total hours of spontaneous and scheduled weekly activity (walking, outdoor games and sports) were quantified, and patients were divided into quartiles. The first quartile included sedentary children whose activity was less than 4 hours per week, mild active patients who developed between 4 to 8 hours of physical activity constituted the second quartile, whereas the third quartile included active children who did 8 to 14 hours of total physical activity weekly, and the last quartile, highly active patients who performed more than 14 hours per week of physical activity. According to a recent systematic review, it was recorded the total up-time without considering the intensity of the physical activity expressed in METs [21]. We also quantified the sedentary time per day (in the lying / sitting position), and the circumference of the umbilical waist, calculating the waist-to-height
We determined the body composition of all participants by dual X-ray absorptiometry (DXA), a method of known precision and accuracy to assessing body fat and lean tissue proportion and distribution. We followed the guidelines of the International Society for Clinical Densitometry (50) for patient preparation and positioning, and data acquisition. Precision was 1.7 % for whole body fat mass, 1.5 % for whole body lean mass and 1.1 % for whole skeleton bone mineral content. We used the EnCore 17 pediatric software provided with the GE Lunar Prodigy Advance densitometer. For avoiding bias, all measurements were performed by the same qualified technician. We quantified total and regional fat and lean mass and calculated ponderal trunk fat mass index (P Tr-FMI = truncal fat tissue in kilograms / height in meters3), ponderal appendicular lean mass index (P Ap-LMI = appendicular lean tissue in kilograms / height in meters3), and total lean / fat ratio (lean tissue in kg / fat tissue in kilograms).
Biochemical variables
In plasma, we determined: fasting glucose by a hexokinase method, insulin by solid phase enzyme-labeled chemiluminescent immunometric assay (IMMULITE 2000XPi, Siemens Healthcare Diagnostics Products Ltd, UK), myostatin (R&G Systems Inc, USA) and adiponectin levels by ELISA (DRG Instruments GmbH, Germany). Hepatic transaminases and c-reactive protein were measured with the same Clinical Chemistry Analyzer (Cobas c501, Roche Diagnostics GmbH, Mannheim, Germany). We calculated the triglycerides / HDL-cholesterol ratio, the glutamate pyruvate transaminase / glutamate oxaloacetate transaminase ratio (GPT / GOT) as a marker of hepatic steatosis, HOMA-IR as a marker of insulin resistance and HOMA-%Beta as a marker of fasting insulin secretion according to the formulas proposed by Matthews [35].
During the oral glucose tolerance test, with an overload of 1.75 g/kg body weight up to 75 g, we determined plasma glucose and insulin at 0, 15, 30, 60, 90, and 120 minutes, and their respective areas under curves (AUC) with the trapezoid formula. We calculated Matsuda’s whole-body insulin sensitivity index
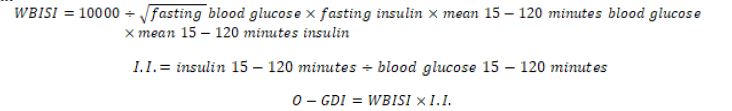
(WBISI) as a marker of global insulin sensitivity [36], insulinogenic index (I.I.) as a marker of insulin secretion, and the oral glucose disposition index (O-GDI) as a marker of diabetes risk [37] with the following formulas:
We also calculated hepatic insulin resistance (H-IR) and muscle insulin sensitivity (M-IS) according to DeFronzo´s
where AUC glucose 0-30 and AUC insulin 0-30 correspond to the areas under the curves from 0 to 30 minutes obtained with the trapezoid formula, D glucose is the variation between blood glucose in the peak and the nadir of de OGTT, and D time is the interval elapsed between those values. We defined impaired fasting glucose (IFG), impaired glucose tolerance (IGT), and diabetes according to the American Diabetes Association diagnostic criteria [39].
Statistical analysis
Statistical analysis was performed with MedCalc® version 11.6.1 program. Kolmogorov-Smirnov tests were run for all data sets to check whether the distribution departed from the normal one. Variables with normal distribution are expressed as arithmetic mean ± standard deviation (SD), while non-parametric variables, as median or geometric mean [IC-95%]. Data analysis included Student’s t-tests, analysis of variance (with logarithmic transformation for not normally distributed variables) followed by Tukey’s HSD test, Fisher’s exact test, chi-squared test, correlation coefficients and multiple regressions. Odds Ratios were calculated to quantify the probability of finding alterations in glucose metabolism for the different quartiles. ROC analysis was used to find an adiponectin / myostatin cut-off value for glucose metabolism alterations. Values of p < 0.05 were significant.
Ethics statement
Each parent and patient included in this study signed informed consents. The Humberto Notti Hospital Ethics Committee on Research approved the working protocol (Resolution number #9/2018).
Results
Table 1 shows the interquartile differences in clinical and densitometric variables, according to the weekly amount of physical activity. There were no significant differences in age, sex, puberty or BMI-z score between groups. Patients of the lower quartile had a long history of overweight and did not develop spontaneous physical activity at all. They also engaged in less scheduled activity and remained two or more hours a day in a sitting / lying position regarding the other quartiles. On the contrary, the most active patients in the fourth quartile of physical activity had significantly lower systolic and diastolic blood pressure percentiles, lower waist-to-height ratio, lower DXA-trunk adiposity, higher lean / fat ratio, and higher lean appendicular mass, showing a healthier body composition.
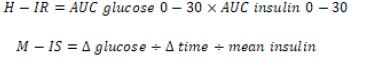
In addition to the differences in body composition and adiposity distribution, we also analyzed the fasting and post-load metabolic variables in the four subgroups of patients (Table 2). C-reactive protein and plasma lipid levels were similar (data not shown). Sedentary patients in the first quartile had a higher GPT / GOT ratio (1.08 ± 0.34 vs. 0.86 ± 0.25; p < 0.05 first vs the fourth quartile) suggesting hepatic steatosis. They had higher fasting and 120 minutes plasma glucose (5.5 ± 0.3 vs. 5.2 ± 0.2 and 6.9 [6.4 – 7.5] vs. 5.6 [5.2 – 6.0] mmol/L, respectively; p < 0.05 first vs the fourth quartile), with a bigger area under the glucose curve. They showed higher HOMA-IR, lower whole body insulin sensitivity (WBISI) (2.5 [1.9 – 3.6] vs. 3.8 [2.6 – 5.6] first vs. the fourth quartile; p < 0.05), lower muscle insulin-sensitivity (Muscle-IS) and higher liver insulin-resistance (Liver-IR). They also had lower adiponectin and increased myostatin plasma levels. The adiponectin / myostatin ratio (Figure 1) was lower in patients with sedentarism, and a cut-off value of 43.5 identified the pediatric patients with obesity likely to have alterations in glucose metabolism, whether impaired fasting glucose, impaired glucose tolerance or diabetes (ROC: 0.70 [0.55-0.80]; sensitivity 80.6; specificity 50.2; p < 0.01).
We specially analyzed diabetes risk among the different subgroups. There were no differences in oral glucose disposition indexes (O-GDI) regarding sex (1.79 ± 0.49 in boys vs. 1.77 ± 0.50 in girls; p = 0.844) but, despite showing a bigger area under the insulin curve, patients from the first quartile had lower O-GDI, indicating a higher risk of developing diabetes compared to the other quartiles (Figure 2). Also, the probability of having an alteration in glucose metabolism, whether impaired fasting glucose, glucose intolerance or diabetes, was higher in patients within the lower distribution of weekly physical activity (OR: 8.87; p < 0.002, 1st-2nd vs. 3rd-4th quartiles), and it was also more common to find in this group a 120 minutes glycemia above 6.7 mmol/L (OR: 12.75; p < 0.005).
Whole body insulin sensitivity index and the insulinogenic index (Figure 3) displayed a hyperbolic relationship, (r = - 0.884, p < 0.001) according to the formula: log(I.I.)=0.202+ b* log(WBISI) , where b = -1.12 (95%CI -1.27 to -0.98). WBISI also displayed a direct correlation with muscle insulin sensitivity (r: 0.65; p < 0.001), with adiponectin (r: 0.43; p < 0.001), and an inverse correlation with HOMA-IR (r: -0.93; p < 0.001) and with hepatic insulin resistance (r: -0.75; p< 0.0001). Adiponectin levels showed an inverse relationship with waist-to-height ratio (r: -0.47; p < 0.001) but, in contrast, myostatin did not show any correlation with the amount or distribution of fat tissue. Instead, it showed a positive correlation with age (r: 0.45; p < 0.001), pubertal stage (p: 0.40; p < 0.01), and HOMA-IR (r: 0.33; p < 0.01), and a negative correlation with adiponectin (r: -0.47; p < 0.001), WBISI (r: -0.38; p < 0.01), and the oral glucose disposition index (r: -0.39; p < 0.005), suggesting that diabetes risk increases with myostatin levels.
In a multiple regression model that included potential factors with influence on total body insulin sensitivity, the main positive predictors were muscle sensitivity, the amount of weekly physical activity, and the adiponectin / myostatin ratio, while hepatic insulin resistance was a negative predictor (Table 3). In other two multiple regression models that included factors with known influence on glucose metabolism, the main positive predictors of fasting plasma glucose were age and HOMA-IR, while the main negative predictors were birth weight, the number of hours spent in weekly physical activity, and HOMA-%Beta (Table 4). On the other hand, the main negative predictors of plasma 120 minutes glucose (Table 5) were the weekly hours spent in total activity, the time elapsed for the decrease in blood glucose from the peak of the OGTT to the nadir and the oral glucose disposition index. The amount of weekly physical activity was an important determinant of fasting and two-hour glucose. Each hour of weekly performed physical activity was associated with a decrease of 0.1 mg/dL (0.0055 mmol/L) of fasting plasma glucose and 0.9 mg/dL (0.05 mmol/L) in 120 minutes glucose. Notably, the other factors that influenced fasting glycemia did not equally affect 120 minutes plasma glucose and vice-versa. The fact of doing more than 4 hours per week of total activity had an impact on the adiponectin / myostatin ratio, muscle insulin sensitivity, and 120 min plasma glucose. A minimum of 8 hours impacted trunk adiposity ponderal mass, hepatic insulin resistance, and fasting plasma glucose. Finally, being active for more than 14 hours per week was reflected in an increase of lean appendicular mass, displayed a beneficial association with systolic blood pressure, and the oral glucose disposition index.
Altogether, these results show the association of the development of usual spontaneous and scheduled physical activity with healthier cardiometabolic parameters and, above all, the association of sedentary habits with insulin resistance, glucose metabolism alterations and diabetes risk in children with obesity probably related with increased plasmatic levels of myostatin.
Discussion
Sedentarism and cardiometabolic risk
International guidelines advise performing 60 minutes per day of physical activity for children aged 5 to 17 years [40]. This recommendation leaves aside the remaining 23 hours a day, which are relevant for children and adolescents with obesity because they may be linked to sedentary habits or spontaneous movements and physical activity. A recent review [19] showed that the restrictions imposed during Covid-19 lockdown were accompanied with reduced movements out of the house and a significant weight gain in children and adolescents, and the weight changes were directly associated with limited or no physical activity at all. Another systematic review [20] indicates that both mild physical activity and decreasing any sedentary behavior are associated with a lower cardiometabolic risk. Another study focused on the relationship between physical activity measured by accelerometry and a metabolic syndrome score in children [16] concluded that the amount of time spent on activities of different intensity is unrelated to metabolic syndrome, and that only moderate / vigorous physical activity (≥ 4 METs) exerts a favorable effect on diastolic blood pressure, unrelated to the other components. By the contrary, from the data shown here, we infer that spontaneous mild-to-moderate physical activity significantly influences cardiometabolic health. Children of the first quartile, with extreme sedentarism, who did not develop spontaneous physical activity at all, have a higher trunk fat distribution even without differences in BMI z-score, with decreased lean / fat ratio in extremities. They also have higher myostatin, lower adiponectin and lower adiponectin / myostatin ratio, along with lower whole-body, muscle and hepatic insulin sensitivity, these findings being consistent with a negative relationship between myostatin levels and insulin sensitivity. Remarkably, our results show that the sedentary lifestyle added to trunk adiposity affects pancreatic beta-cell compensation to insulin resistance and increases the likelihood of developing diabetes, as indicated by the decrease in oral-glucose disposition index, a validated predictor of diabetes risk in obese youth [6-7,37]. The results of the present work show the potential harmful impact of a sedentary lifestyle on cardiometabolic risk in patients with obesity at the pediatric age; however, in agreement with the conclusions of an updated review (21), the risk may be reversible with lifestyle changes.
There are several methods for evaluating the effects of physical activity on the pediatric population, of which accelerometry is the standard one. Among other alternative methods, the quantification of the time spent in the development of physical activity, rather than its intensity in METs, has been previously used to assess its benefits on pediatric health [41]. Also, interviewer-administered questionnaires, including the one used in this work, have been validated in children and adolescents [33,42,43]. Here, we quantified the weekly amount of total physical activity and separately recorded spontaneous and scheduled ones, empirically estimating as mild-moderate the first, and moderate-intense the last. Patients in the upper quartile, which includes the most active children, get the maximum benefit on cardiometabolic health by developing more than 15 hours of spontaneous, one more hour of scheduled activity per week, and remaining two hours less in the sitting or lying position per day. Remarkably, the time spent in spontaneous mild-to-moderate physical activity, such as walking or playing outdoors, was the main difference between groups.
A recent study [44] that included 841 school-age children, using a multivariate analysis, concluded that vigorous physical activity has a strong correlation with a multiple health score while moderate activity shows a weaker relationship, mild activity is neutral, and sedentary time has an inverse relationship. It should be noted that, contrary to the present work, the score used by Aadland et al did not include blood glucose as a variable. The results reported here agree with this previous study in finding more obvious cardiometabolic benefits in more active patients (less accentuated trunk adiposity, a more favorable body composition, lower blood pressure and higher hepatic and muscle insulin sensitivity). Unlike the previous study, our work highlights the beneficial association of physical activity with proper glucose metabolism indicators in children and adolescents with obesity, expressed by a higher oral glucose disposition index along with a lower prevalence of glycemic alterations (impaired fasting glucose, impaired glucose tolerance or diabetes).
Adiponectin, myostatin and insulin sensitivity
The higher plasmatic concentrations of adiponectin in the most active quartile, associated with lower plasmatic concentrations of myostatin and the increase in the ratio between both, allows us to suggest that muscle tissue, through its cross-communication with adipose tissue, plays a direct beneficial role on cardiometabolic health in children and adolescents with obesity. Myostatin is the only myokine that decreases in response to exercise and increases with a sedentary lifestyle. Its inhibition stimulates muscle growth in a paracrine-autocrine way, while it attenuates obesity and insulin resistance through its endocrine action on lipolysis and mitochondrial oxidation in adipose tissue and liver [22]. In addition, myostatin promotes the browning of fat tissue through the activation of MAP-Kinase of muscle fiber and the expression of irisin and other myokines [23]. The lower levels of myostatin in the most active group may be responsible for lower trunk adiposity, higher appendicular lean mass and lower insulin resistance. Our findings indicate that the adiponectin / myostatin ratio below a cut-off value of 43.5 would be a cardiometabolic risk marker in pediatric obesity, but longitudinal studies with a larger sample of patients are required.
Adapting to a high-fat or high-carbohydrate diet by changing the use of substrates to obtain the same proportion of macronutrients is critical to prevent weight gain. There is evidence of early metabolic inflexibility in adolescents with obesity, with a poor adaptive response to high-fat or carbohydrate diets, which appears to be related to decreased levels of adiponectin [45]. It has been previously shown that increasing the level of physical activity is associated with improved metabolic flexibility in young first-degree relatives of patients with type 2 diabetes [46]. The benefits of physical activity over metabolic flexibility in children with obesity are associated with a higher level of lipid oxidation and insulin-stimulated glucose uptake during training [47]. In this work, the differences found in fasting and 120 minutes plasma glucose and glucose disposition index between the activity quartiles could be interpreted, at least in part, as due to increased metabolic flexibility. The higher level of adiponectin in the active groups is consistent with this hypothesis.
Physical activity level, body composition and cardiometabolic risk
In one cohort study of 630 children with at least one parent with obesity [48], the relationship between physical activity and insulin sensitivity was dependent on the percentage of fat mass. In this work, the beneficial relationship of physical activity with cardiometabolic health is related to differences in body composition, without differences in BMI-z score. The sedentary time spent in the sitting or lying position is associated with trunk adiposity while highly active patients of the upper quartile have higher lean appendicular mass along with healthier cardiometabolic parameters such as lower blood pressure, a higher insulin sensitivity and a higher oral glucose disposition index. In the face of our results, it would be possible to postulate that the benefit of physical activity in pediatric obesity is related to body composition, through an increase in appendicular lean mass, and that sedentary lifestyle acts through a metabolic inflexibility linked to trunk adiposity and a lower adiponectin/myostatin ratio.
One weakness of the present work is the fact that we didn´t consider participants’ dietary habits. However, in two previous different publications carried out in our country by our and another research team [9,34], no differences were found related to food consumption in children with or without obesity.
In summary, pediatric patients with obesity and a family history of metabolic syndrome who develop spontaneous mild-to-moderate physical activity have healthier cardiometabolic parameters than those with sedentarism. Thus, children who minimally exert four hours of physical activity per week have higher adiponectin / myostatin ratio and muscle insulin sensitivity, and lower post-load blood glucose. More than eight hours of physical activity is linked to lower trunk adiposity, hepatic insulin resistance, and fasting blood glucose. Finally, more than 14 hours per week of spontaneous or scheduled physical activity are associated with higher lean appendicular mass, lower blood pressure, and lower risk of glucose disturbances expressed as a higher glucose disposition index. We conclude that the decrease of sedentary time and the spontaneous development of mild-moderate intensity physical activity, such as walking or playing outdoor games, have a significant role in preventing alterations of glucose metabolism in pediatric obesity. Our results support the notion that school programs that implement more than four hours of physical activity weekly and health policies to promote recreational outdoor activities for children and adolescents, with the necessary care during the Covid-19 pandemics, could reverse the growing trend in pediatric obesity and type 2 diabetes faced nowadays.
Conflict of Interest / Funding
The authors declare that the research was conducted in the absence of any commercial or financial relationship that could be construed as a potential conflict of interest. The prebsent work was carried out with funds from the Directorate of Science and Technology of Mendoza Government (DICYT). The funding organization played no role in the study design; in the collection, analysis, and interpretation of data; in the writing of the report; or in the decision to submit the report for publication.
Acknowledgments / Author Contributions
We kindly thank Mrs. Cristina Ciccarelli for reviewing the manuscript in terms of language aspects. All authors listed have made a substantial, direct and intellectual contribution to the work, and approved it for publication. ZG, TD, IQ conceived the study and designed the analysis plan. ZG interpreted the data and did the statistical analyses. ZG, TD, SM, FS wrote the manuscript. ZG, CM, JP, LC, FB contributed to obtain the data. FS did and interpreted the dual X-ray absorptiometry (DXA). LC, FB did the biochemical determinations.
- Pretto ADB, Kaufmann CC, Dutra GF, Albernaz EP. Prevalence of factors associated to metabolic syndrome in a cohort of children in South Brazil. Nutricion Hospitalaria. (2015) 32(1):118–23. doi:10.3305/nh.2015.32.1.8861.
- Santoro N, Amato A, Grandone A, et al. Predicting metabolic syndrome in obese children and adolescents: Look, measure and ask. Obesity Facts. (2013) 6(1):48–56. doi: 10.1159/000348625.
- Goran MI, Bergman RN, Avila Q, et al. Impaired glucose tolerance and reduced β-Cell function in overweight Latino children with a positive family history for type 2 diabetes. Journal of Clinical Endocrinology and Metabolism. (2004) 89(1):207–12. doi: 10.1210/jc.2003-031402.
- Burrows R, Correa-Burrows P, Reyes M, Blanco E, Albala C, Gahagan S. Healthy chilean adolescents with HOMA-IR ≥ 2.6 have increased cardiometabolic risk: Association with genetic, biological, and environmental factors. Journal of Diabetes Research. (2015) 2015:1–8. doi:10.1155/2015/783296.
- Akinci G, Coskun S, Akinci B, et al. Atherosclerosis risk factors in children of parents with the metabolic syndrome. Atherosclerosis. (2007) 194(2):e165–71. doi:10.1016/j.atherosclerosis.2006.12.008.
- Bacha F, Lee S, Gungor N, Arslanian SA. From pre-diabetes to type 2 diabetes in obese youth: Pathophysiological characteristics along the spectrum of glucose dysregulation. Diabetes Care (2010) 33(10):2225–31. doi: 10.2337/dc10-0004.
- Burns SF, Bacha F, Lee SJ, Tfayli H, Gungor N, Arslanian SA. Declining β-cell function relative to insulin sensitivity with escalating OGTT 2-h glucose concentrations in the nondiabetic through the diabetic range in overweight youth. Diabetes Care. (2011) 34(9):2033–40. doi:10.2337/dc11-0423.
- Haam JH, Kim YS, Koo HS, et al. Intermuscular adipose tissue is associated with monocyte chemoattractant protein-1, independent of visceral adipose tissue. Clinical Biochemistry. (2016) Apr 1, 49(6):439–43. doi: 10.1016/j.clinbiochem.2015.12.003.
- Figueroa Sobrero A, Evangelista P, Kovalskys I, et al.Cardio-metabolic risk factors in Argentine children. A comparative study. Diabetes and Metabolic Syndrome: Clinical Research and Reviews. (2016) 10(1):S103–9. doi: 10.1016/j.dsx.2015.10.003.
- Lee SJ, Bacha F, Gungor N, Arslanian S. Comparison of different definitions of pediatric metabolic syndrome: Relation to abdominal adiposity, insulin resistance, adiponectin, and inflammatory biomarkers. Journal of Pediatrics. (2008) 8;152(2):177–84. doi: 10.1016/j.jpeds.2007.07.053.
- Weiss R. Metabolic syndrome in childhood - Causes and effects. Endocrine Development. (2010) 19:62–72. doi: 10.1159/000316898.
- Weiss R, Bremer AA, Lustig RH. What is metabolic syndrome, and why are children getting it? Annals of the New York Academy of Sciences. (2013) 1281(1):123–40. doi: 10.1111/nyas.12030.
- Alterio A, Alisi A, Liccardo D, Nobili V. Non-alcoholic fatty liver and metabolic syndrome in children: A vicious circle. Hormone Research in Paediatrics. (2014) 82:283–9. doi: 10.1159/000365192.
- Hodson L, Gunn PJ. The regulation of hepatic fatty acid synthesis and partitioning: the effect of nutritional state. Nature Reviews Endocrinology. (2019) 15:689–700.doi: 10.1038/s41574-019-0256-9.
- Madeira I, Bordallo MA, Rodrigues NC, et al. Leptin as a predictor of metabolic syndrome in prepubertal children. Archives of Endocrinology and Metabolism. (2017) 61(1):7–13.doi: 10.1590/2359-3997000000199.
- Roth CL, Kratz M, Ralston MM, Reinehr T. Changes in adipose-derived inflammatory cytokines and chemokines after successful lifestyle intervention in obese children. Metabolism: Clinical and Experimental. (2011) 60(4):445–52. doi:10.1016/j.metabol.2010.03.023.
- Gepstein V, Weiss R. Obesity as the main risk factor for metabolic syndrome in children. Frontiers in Endocrinology. (2019) 10:e1–9. doi: 10.3389/fendo.2019.00568.
- Saunders TJ, Chaput JP, Tremblay MS. Sedentary behaviour as an emerging risk factor for cardiometabolic diseases in children and youth. Canadian Journal of Diabetes. (2014) 38:53–61. doi: 10.1016/j.jcjd.2013.08.266.
- Stavridou A, Kapsali E, Panagouli E, Thirios A, Polychronis K, Bacopoulou F. Obesity in children and adolescents during COVID-19 pandemic. Children (Basel). 2021 Feb 12;8(2):135. doi: 10.3390/children8020135.
- Tremblay MS, LeBlanc AG, Kho ME, et al. Systematic review of sedentary behaviour and health indicators in school-aged children and youth. International Journal of Behavioral Nutrition and Physical Activity. (2011) Sep 21, 8:98. doi: 10.1186/1479-5868-8-98.
- Carson V, Hunter S, Kuzik N, et al. Systematic review of sedentary behaviour and health indicators in school-aged children and youth: An update. Applied Physiology, Nutrition and Metabolism. Canadian Science Publishing. (2016) 41:S240–65. doi: 10.1139/apnm-2015-0630.
- Schnyder S, Handschin C. Skeletal muscle as an endocrine organ: PGC-1α, myokines and exercise. Bone. (2015) 80:115–25. doi:10.1016/j.bone.2015.02.008.
- Huh JY. The role of exercise-induced myokines in regulating metabolism. Archives of Pharmacal Research. Pharmaceutical Society of Korea. (2018) 41:14–29. doi:10.1007/s12272-017-0994-y.
- Bergouignan A, Antoun E, Momken I, et al. Effect of contrasted levels of habitual physical activity on metabolic flexibility. J Appl Physiol [Internet]. (2013) 114:371–9.doi:10.1152/japplphysiol.00458.2012.
- Rudwill F, O’Gorman D, Lefai E, et al. Metabolic Inflexibility is an early marker of bed-rest-induced glucose intolerance even when fat mass is stable. Journal of Clinical Endocrinology and Metabolism. (2018) 103(5):1910–20. doi: 10.1210/jc.2017-02267.
- Ozemek C, Laddu DR, Lavie CJ, et al. An update on the role of cardiorespiratory fitness, structured exercise and lifestyle physical activity in preventing cardiovascular disease and health risk. Progress in Cardiovascular Diseases. (2018) 61:484–90. doi:10.1016/j.pcad.2018.11.005.
- Aune D, Norat T, Leitzmann M, Tonstad S, Vatten LJ.Physical activity and the risk of type 2 diabetes: A systematic review and dose-response meta-analysis. European Journal of Epidemiology. (2015) 30(7):529–42. doi: 10.1007/s10654-015-0056-z.
- Geria K, Beitz JM. Application of a modified diabetes prevention program with adolescents. Public Health Nursing. (2018) 35(4):337–43. doi: 10.1111/phn.12379.
- Narasimhan S, Weinstock RS. Youth-onset type 2 diabetes mellitus: Lessons learned from the TODAY study. Mayo Clinic Proceedings. (2014) 89:806–16.doi: 10.1016/j.mayocp.2014.01.009.
- Linder BL, Fradkin JE, Rodgers GP. The TODAY study: An NIH perspective on its implications for research. Diabetes Care. (2013) 36:1775–6. doi: 10.2337/dc13-0707.
- Arslanian S, el Ghormli L, Bacha F, et al. Adiponectin, insulin sensitivity, β-cell function, and racial/ethnic disparity in treatment failure rates in TODAY. Diabetes Care. (2017) 40(1):85–93. doi: 10.2337/dc16-0455.
- Roccella EJ. Update on the 1987 task force report on high blood pressure in children and adolescents: A working group report from the national high blood pressure education program. Pediatrics. (1996) 98(4 Pt 1):649–58.
- Claude Godard M, María Del Pilar Rodríguez N, Díaz N, Lydia Lera M, Gabriela Salazar R, Raquel Burrows A. Valor de un test clínico para evaluar actividad física en niños. Revista Médica de Chile. (2008) 136(9):1155–62.
- Guntsche Z, Guntsche EM, Saraví FD, et al. Umbilical waist-to-height ratio and trunk fat mass index (DXA) as markers of central adiposity and insulin resistance in Argentinean children with a family history of metabolic syndrome. Journal of Pediatric Endocrinology and Metabolism. (2010) 23(3):245–56. doi: 10.1515/jpem.2010.23.3.245.
- Guntsche Z, Guntsche EM, Saraví FD, et al. Umbilical waist-to-height ratio and trunk fat mass index (DXA) as markers of central adiposity and insulin resistance in Argentinean children with a family history of metabolic syndrome. Journal of Pediatric Endocrinology and Metabolism. (2010) 23(3):245–56. doi: 10.1515/jpem.2010.23.3.245.
- Matsuda M, DeFronzo RA. Insulin sensitivity indices obtained from oral glucose tolerance testing: Comparison with the euglycemic insulin clamp. Diabetes Care. (1999) 22(9):1462–70. doi: 10.2337/diacare.22.9.1462.
- Retnakaran R, Shen S, Hanley AJ, Vuksan V, Hamilton JK, Zinman B. Hyperbolic relationship between insulin secretion and sensitivity on oral glucose tolerance test. Obesity. (2008) 16(8):1901–7. doi: 10.1038/oby.2008.307.
- Abdul-Ghani MA, Matsuda M, Balas B, DeFronzo RA. Muscle and liver insulin resistance indexes derived from the oral glucose tolerance test. Diabetes Care. (2007) 30(1):89–94. doi: 10.2337/dc06-1519.
- Association AD. American Diabetes Association: Diagnosis and classification of diabetes mellitus. Diabetes Care. (2014) 37(1):S81–90. doi: 10.2337/dc13-S067.
- World Health Organization. Global recommendations on physical activity for health. WHO Library Cataloguing-in-Publication Data. Global recommendations on physical activity for health. World Health Organization. (2010) 17–22.
- Sallis JF, Buono MJ, Roby JJ, Micale FG, Nelson JA. Seven-day recall and other physical activity self-reports in children and adolescents. Medicine and Science in Sports and Exercise. (1993) 25(1):99–108. doi: 10.1249/00005768-199301000-00014.
- Lockwood J, Jeffery A, Schwartz A, et al. Comparison of a physical activity recall questionnaire with accelerometry in children and adolescents with obesity: a pilot study. Pediatric Obesity. (2017) 12(5):e41–5. doi: 10.1111/ijpo.12172.
- Sallis JF, Strikmiller PK, Harsha DW, et al. Validation of interviewer- and self-administered physical activity checklists for fifth grade students. Medicine and Science in Sports and Exercise. (1996) 28(7):840–51. doi: 10.1097/00005768-199607000-00011.
- Aadland E, Kvalheim OM, Anderssen SA, Resaland GK, Andersen LB. The multivariate physical activity signature associated with metabolic health in children. International Journal of Behavioral Nutrition and Physical Activity. (2018) 15(1):77–88. https://doi.org/10.1186/s12966-018-0707-z.
- Aucouturier J, Duché P, Timmons BW. Metabolic flexibility and obesity in children and youth. Obesity Reviews. (2011) 12(5):e44–e53. doi: 10.1111/j.1467-789X.2010.00812.x.
- Ahn CW, Song YD, Nam JH, et al. Insulin sensitivity in physically fit and unfit children of parents with Type 2 diabetes. Diabetic Medicine. (2004) 21(1):59–63. doi:10.1046/j.1464-5491.2003.01049.x.
- Bell LM, Watts K, Siafarikas A, et al. Exercise alone reduces insulin resistance in obese children independently of changes in body composition. Journal of Clinical Endocrinology and Metabolism. (2007) 92(11):4230–5. doi: 10.1210/jc.2007-0779.
- Henderson M, Gray-Donald K, Mathieu ME, et al. How are physical activity, fitness, and sedentary behavior associated with insulin sensitivity in children? Diabetes Care. (2012) 35(6):1272–8. doi: 10.2337/dc11-1785.
- Dubose KD, McKune AJ, Brophy P, Geyer G, Hickner RC. The relationship between physical activity and the metabolic syndrome score in children. Pediatric Exercise Science. (2015) 27(3):364–71. doi:10.1123/pes.2014-0134.
- Hangartner TN, Warner S, Braillon P, Jankowski L, Shepherd J. The Official Positions of the International Society for Clinical Densitometry: Acquisition of Dual-Energy X-Ray Absorptiometry Body Composition and Considerations Regarding Analysis and Repeatability of Measures. Journal of Clinical Den
Figure 1
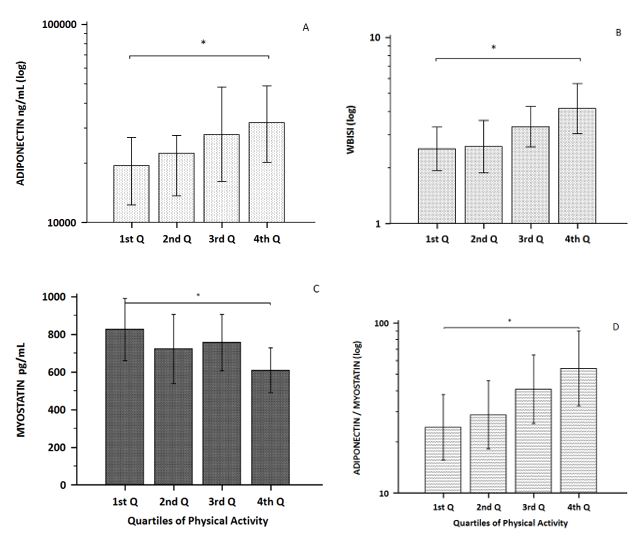
Figure 1: Adiponectin (A) and whole-body insulin sensitivity index (B) increase with weekly h of activity, while myostatin levels (C) decrease. The adiponectin/myostatin ratio (D) is lower in less active patients.; * p < 0.05. Y axes in logarithmic scale, except for myostatin. 1st Q, 2nd Q, 3rd Q and 4th Q: first, second, third and fourth quartiles (Q)
Figure 2
Figure 2: Patients in the first quartile, who develop up to 4 h of weekly physical activity, have a lower oral glucose disposition index, with higher fasting and 120 min plasma glucose (*p < 0.05; **p < 0.01). Glycemia 120 min.: plasmatic glucose at 120 min of OGTT; O-GDI: oral glucose disposition index. 1st Q, 2nd Q, 3rd Q and 4th Q: first, second, third and fourth quartiles (Q) of weekly physical activity. Y axis expresses glycemia in grams/liter and GDI units
Figure 3
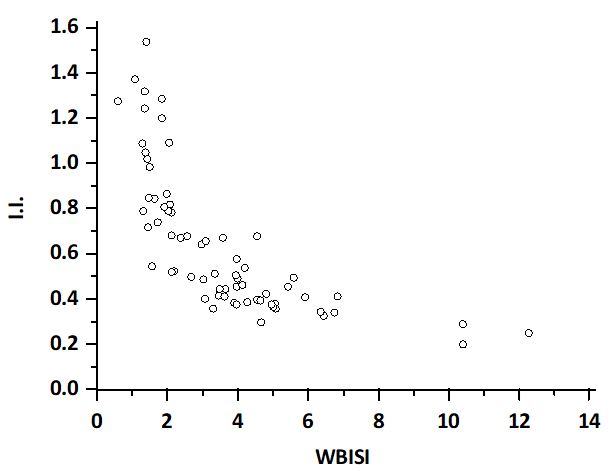
Figure 3: Hyperbolic relationship between Insulinogenic Index (I.I.) and Whole-Body Insulin Sensitivity Index (WBISI). The patients in the lower distribution of the hyperbola have an increased diabetes risk
Tables at a glance
Figures at a glance