|
Disease group
(n=25) |
Control group (n=23) |
p value |
Mean age |
45 +/- 7 |
48 +/- 6 |
0.1 |
Family history of glaucoma |
2 |
4 |
0.33# |
Gonioscopy |
Open |
Open |
|
Spherical equivalent (dioptre) |
-1.7 +/- 1.7 |
-1.9 +/- 2.7 |
0.8 |
Central corneal thickness (um) |
548 +/- 26 |
548 +/- 26 |
0.9 |
IOP (mmHg) |
15 +/- 3 |
14 +/- 2 |
0.4 |
CDR |
0.3 |
0.3 |
1.0 |
PBAC |
1815 +/- 1944 |
35.3 +/- 49.6 |
<0.0001 |
Menorrhagia duration (years) |
2.6 |
NA |
|
Ferritin (ng/mL) |
44.05 +/- 48.3 (n=23) |
NA |
|
Pre-transfusion Hb (g/dl) |
8.04 +/- 1.97 (n=23) |
NA |
|
Table1 Table showing baseline data for study subjects
|
Disease group (n=25) |
Control group
(n=23) |
p value |
PSD |
2.73 +/- 1.9 |
1.82 +/- 0.42 |
<0.01 |
MD |
-3.0 +/- 3.3 |
-2.28 +/- 1.26 |
0.35 |
VFI |
95.64 +/- 7.5 |
97.4 +/- 1.9 |
0.34 |
NFL |
105.6 +/- 11.4 |
103.8 +/- 10.0 |
0.57 |
Table2 Table comparing the mean visual field global indices and average NFL thickness in the disease group and control group
|
All subjects
(n = 48) |
Disease group
(n= 25) |
Control group (n= 23) |
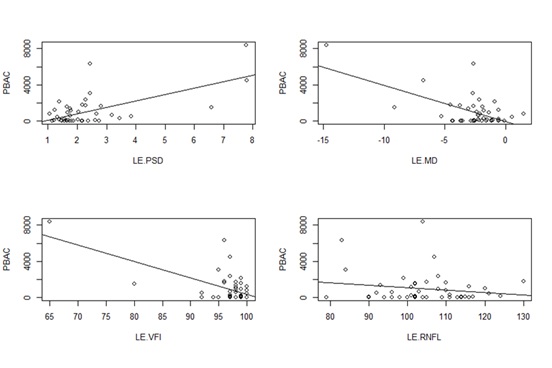
PSD against PBAC
Correlation coefficient
(p value) |
0.63
(<0.0001) |
0.60
(0.009) |
-0.28
(0.22) |
MD against PBAC
Correlation coefficient
(p value) |
-0.61
(0.001) |
-0.68
(0.003) |
0.46
(0.04) |
VFI against PBAC
Correlation coefficient
(p value) |
-0.61
(0.003) |
-0.65
(0.009) |
0.22
(0.35) |
NFL against PBAC
Correlation coefficient
(p value) |
-0.17
(0.27) |
-0.33
(0.11) |
0.02
(0.93) |
Table3 Table tabulating the correlation coefficient calculated using Pearson’s correlation analysis
|
Normal menses (n=9) |
Menopause
(n=14) |
p value |
PSD |
1.66 +/- 0.44 |
1.95 +/- 0.38 |
0.15 |
MD |
-1.66 +/- 1.33 |
-2.79 +/- 0.97 |
0.06 |
VFI |
97.8 +/- 1.8 |
97.1 +/- 2.0 |
0.45 |
NFL |
104.8 +/- 10.5 |
103.2 +/- 10.1 |
0.72 |
Table4 Table comparing the mean VF indices and NFL thickness between subjects with normal menses and subjects with menopause
|
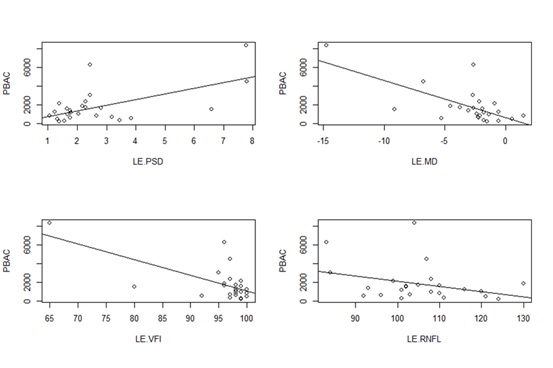
All subjects
(n = 34) |
Control group
(n= 9) |
PSD against PBAC
Correlation coefficient
(p value) |
0.63 (<0.003) |
0.09 (0.83) |
MD against PBAC
Correlation coefficient
(p value) |
-0.67 (0.001) |
0.14 (0.72) |
VFI against PBAC
Correlation coefficient
(p value) |
-0.64 (0.003) |
0.21 (0.59) |
NFL against PBAC
Correlation coefficient
(p value) |
-0.25 (0.16) |
-0.2 (0.6) |
Table5 Table tabulating the correlation coefficient calculated using Pearson’s correlation analysis, with menopause subjects excluded