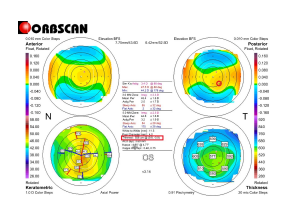
Figure 1: Pre-L-LAK-CXL Orbscan map . Right bottom shows a pachymetric map: an example of measuring the differences in thickness between symmetrically opposed points is shown on the pachymetric map (0–180°, 45–225°, 90–270°, and 135–315°): 0-180°: 13 μm; 45–225°: 19 μm; 90–270°: 49 μm; 135–315°:48 μm; total (SUM): 129 μm. Right top map: Measuring the distance between the maximum posterior elevation (best-fit-sphere; BFS) and the visual axis (DISTANCE :1.20). Corneal apex: temporally deviated (right upper red circle). The thinnest point (X, Y) is indicated by the lower red square, and the posterior high on thicker cornea, and front elevation on the thinner cornea is also shown. Kmax is 47.3 D
Tables at a glance
Figures at a glance