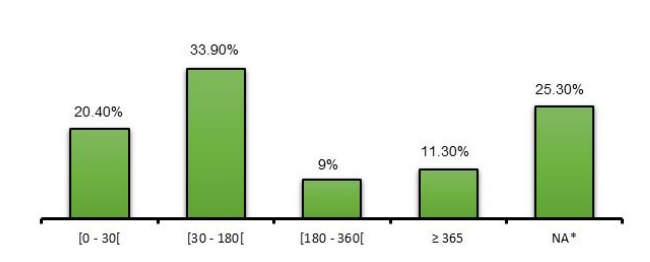
Figure 1: Distribution of Patients Practicing Self-Medication Based on the Onset of Symptoms
*NA : Not applicable
|
n |
% |
Age groups (years) |
|
|
<18 |
38 |
17,20 |
[18 – 40] |
62 |
28,10 |
[40 – 60] |
67 |
30,30 |
[60 – 80] |
49 |
22,20 |
[80 – 100] |
5 |
2,30 |
Profession |
|
|
Civil servant |
63 |
28,50 |
Pupil/Student |
62 |
28,10 |
Retired |
44 |
19,90 |
Retailer |
23 |
10,40 |
Self-employed |
16 |
7,20 |
Unemployed |
13 |
5,90 |
Education level |
|
|
No |
12 |
5,40 |
Primary |
24 |
10,90 |
Secondary |
67 |
30,30 |
Superior |
118 |
53,40 |
Distance from house to nearest health facility (in Km) |
|
|
<10 |
38 |
17,20 |
[10 – 30] |
110 |
49,80 |
≥ 30 |
73 |
33,0 |
Table 1: Distribution of Patients Practicing Self-Medication According to Sociodemographic Characteristics (n=221)
|
n |
% |
Visuel drop |
94 |
42,50 |
Headaches |
27 |
12,20 |
Diplopia |
4 |
1,80 |
Eye pain |
27 |
12,20 |
Eye fatigue |
4 |
1,80 |
Loucherie |
2 |
0,9 |
Photophobia |
24 |
10,90 |
Eye redness |
33 |
14,90 |
Sensation of a foreign body in the eye |
16 |
7,20 |
Table 2: Distribution of Patients Practicing Self-Medication According to Reasons for Consultation (n=221)
|
n |
% |
Infections/inflammatory diseases |
|
|
Allergic conjunctivitis |
45 |
20,40 |
Bacterial conjunctivitis |
12 |
5,40 |
Viral conjunctivitis |
2 |
0,90 |
LCET |
3 |
1,40 |
Corneal abscess |
7 |
3,20 |
Pterygium |
9 |
4,10 |
Keratitis |
2 |
0,90 |
Maladies dégénératives |
|
|
Retinopathy HTA |
6 |
2,70 |
Diabetic retinopathy |
1 |
0,50 |
Myopia |
16 |
7,20 |
Hyperopia |
26 |
11,80 |
Presbyopia |
19 |
8,60 |
Astigmatism |
14 |
6,30 |
Ametropia |
20 |
9,00 |
Cataracts |
38 |
17,20 |
CAPM |
20 |
9,00 |
Table 3: Distribution of patients practicing self-medication in ophthalmology based on diagnoses made
|
n |
% |
Plantes |
18 |
8,1 |
Kpatima |
7 |
38,90 |
Yyovo kpatin |
5 |
27,80 |
Tchayo |
3 |
16,70 |
Klouékoun-man |
1 |
5,60 |
Other non-medicated products |
132 |
59,70 |
Sweet water |
66 |
50,0 |
Salt water/Sea water |
49 |
37,10 |
Palm oil |
27 |
20,50 |
Moringa powder |
17 |
12,90 |
Lemon |
15 |
11,40 |
Honey |
11 |
8,30 |
Ahowé |
3 |
2,30 |
Table 4: Distribution of patients practicing self-medication in ophthalmology based on types of non-pharmaceutical products used (n=221)
|
n |
% |
Intention d’achat |
|
|
Patient himself |
187 |
37,30 |
A health agent |
50 |
10,0 |
A parent |
83 |
16,60 |
NA* |
181 |
36,10 |
Sources d’approvisionnement |
|
|
Pharmacy |
113 |
51,10 |
Market |
85 |
38,50 |
Street vendor |
39 |
17,60 |
Beach |
30 |
13,60 |
Parent |
18 |
8,10 |
Table 5: Distribution of patients practicing self-medication in ophthalmology based on types of non-pharmaceutical products used (n=221)
NA : Not applicables
|
Total n |
Self-medication in ophthalmology |
RP |
[IC95% RP] |
p |
|
Yes |
% |
|||||
Age (years) |
|
|
|
|
|
0,016 |
≥ 30 |
354 |
144 |
40,70 |
0,77 |
0,63 - 0,94 |
|
< 30 |
147 |
77 |
52,40 |
1 |
- |
|
Gender |
|
|
|
|
|
0,006 |
Female |
267 |
133 |
49,80 |
1,32 |
1,08 - 1,63 |
|
Male |
234 |
88 |
37,60 |
1 |
- |
|
Profession |
|
|
|
|
|
0,987 |
Informal sectotr |
358 |
158 |
43,40 |
1 |
0,80 - 1,25 |
|
Formel sector |
143 |
63 |
56,60 |
1 |
- |
|
Education level |
|
|
|
|
|
0,688 |
No |
25 |
12 |
5,40 |
1,09 |
0,71 - 1,66 |
|
Educated |
476 |
209 |
94,57 |
1 |
- |
|
Table 6: Relationship between self-medication and sociodemographic characteristics
|
Total n |
Self-medication in ophthalmology |
RP |
[IC95% RP] |
p |
|
Yes |
% |
|||||
Perception consultation costs |
|
|
|
|
|
0,225 |
Dear |
466 |
209 |
44,80 |
1,30 |
0,82 - 2,09 |
|
Cheaper |
35 |
12 |
34,30 |
1 |
|
|
Easy access to consultation appointments |
|
|
|
|
|
0,821 |
Difficult |
47 |
20 |
42,60 |
0,96 |
0,67 - 1,36 |
|
Easy |
454 |
201 |
44,30 |
1 |
|
|
Quality of welcome |
|
|
|
|
|
0,005 |
Poor quality |
168 |
89 |
53 |
1,34 |
1,10 - 1,62 |
|
Good quality |
333 |
132 |
39,60 |
1 |
|
|
Waiting time |
|
|
|
|
|
0,962 |
Long |
456 |
201 |
44,10 |
0,99 |
0,704 - 1,39 |
|
Short |
25 |
20 |
44,20 |
1 |
|
|
Table 7: Relationship between self-medication and healthcare system
|
Total n |
Self-medication in ophthalmology |
RP |
[IC95%RP] |
P |
|
Yes |
% |
|||||
Knowledge of self-medication |
|
|
|
|
|
0,0001 |
No |
152 |
85 |
55,92 |
1,43 |
1,18 - 1,74 |
|
Yes |
349 |
136 |
38,97 |
1 |
- |
|
Knowledge of the consequences of self- medication |
|
|
|
|
|
0,004 |
No |
377 |
180 |
47,74 |
1,44 |
1,10 - 1,89 |
|
Yes |
124 |
41 |
33,06 |
1 |
- |
|
Aware of the consequences of self-medication |
|
|
|
|
|
0,332 |
No |
86 |
42 |
48,83 |
1,13 |
0,88 -1,443 |
|
Yes |
415 |
179 |
43,13 |
1 |
- |
|
Table 8: Relationship between the practice of self-medication and patients' knowledge of self-medication
|
Total n |
Self-medication in ophthalmology |
RP |
[IC95%RP] |
P |
|
Yes |
% |
|||||
Patient |
|
|
|
|
|
0,006 |
New |
293 |
143 |
48,81 |
1,30 |
1,05 - 1,60 |
|
Former |
208 |
78 |
37,50 |
1 |
- |
|
Table 9: Relationship between the practice of self-medication and patient tenure
Figure 1: Distribution of Patients Practicing Self-Medication Based on the Onset of Symptoms
*NA : Not applicable
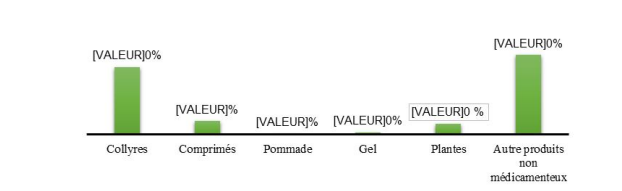
Figure 2: Distribution of patients practicing self-medication based on the products used (n=221)
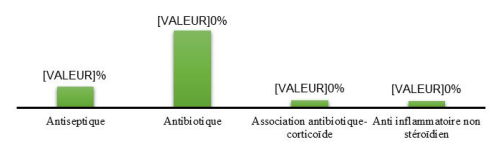
Figure 3: Distribution of patients practicing self-medication based on therapeutic classes (n= 221)
Tables at a glance
Figures at a glance