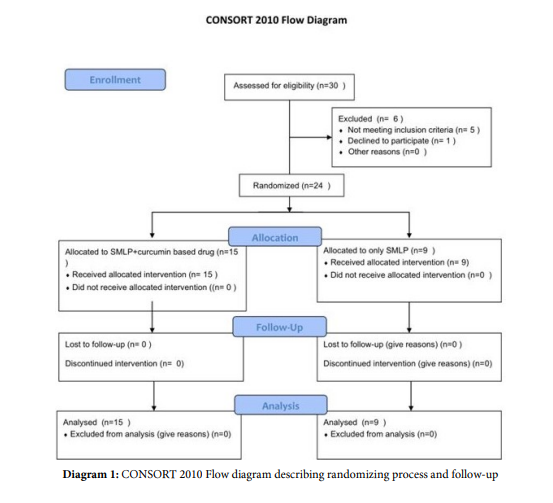
Diagram 1: CONSORT 2010 Flow diagram describing randomizing process and follow-up
Diagram 1: CONSORT 2010 Flow diagram describing randomizing process and follow-up
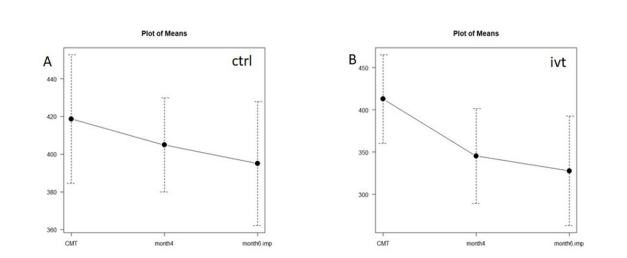
Figure 1 and Figure 2: CMT standard deviation over follow-up period; ctrl=control group; ivt=treated group
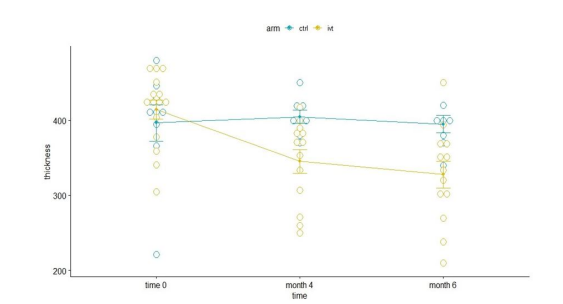
Figure 3: Mean standard deviation of central macular thickness at time 0, time 4 months and time 6 months
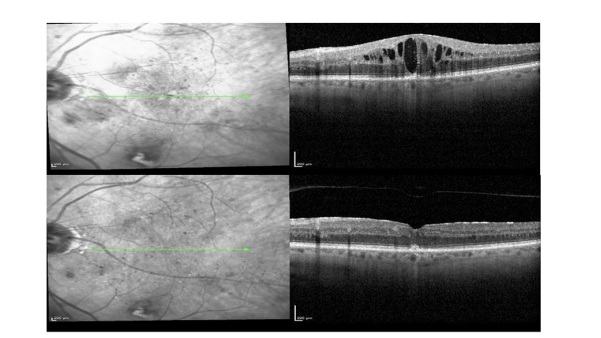
Figure 4: OCT overview report of a patient in the ivt (treatment) group: in the upper part at tima 0, in the lower part at time 6 months after treatment
Tables at a glance
Figures at a glance