Table 1: Age and sex distribution of the surveyed students
Table 2: Prevalence of blindness, vision impairment and refractive error by class category
*5 students had no refractive records
Table 3: Multivariate logistic regression analysis of risk factors for myopia, hypermetropia, and astigmatism
Table 4: Effective refractive error coverage (persons/eyes), effective clinical refractive error coverage and effective glasses need by students’ classes
*eREC= Effective Refractive error coverage
**e-CREC = Effective clinical refractive error coverage
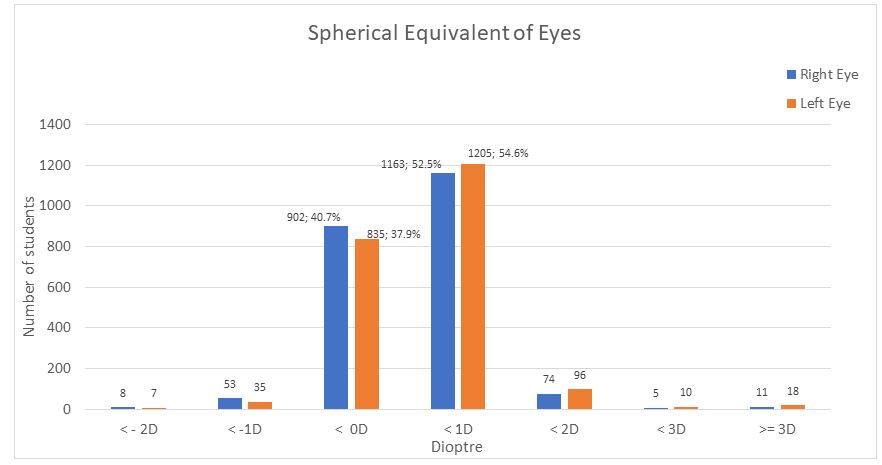
Figure 1: Spherical equivalent of Right and Left eyes
Tables at a glance
Figures at a glance