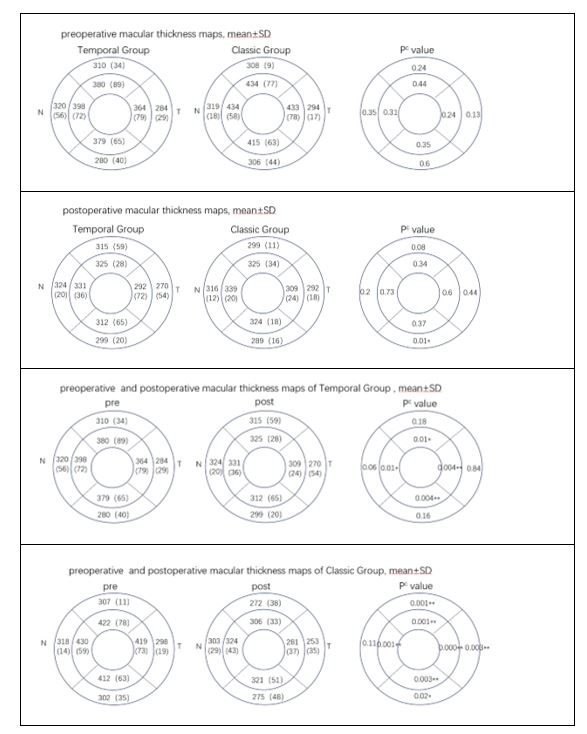
Table 3: Changes in macular thickness before and after surgery (last postoperative follow-up within 6 months)
N=nasal T=temporal cMann-whitney U test
*=P<0.05 **=P<0.01
| Temporal Group | Classic Group | P value | |
| NO. of patients, n | 13(14eyes) | 14(15eyes) | |
| Age(years),mean±SD | 61.85±8.14 | 61.43±10.13 | 0.91a |
| Gender(female), n(%) | 8(57.14%) | 10(71.43) | 0.86b |
| Preoperative BCVA(log MAR) | 1.08±0.37 | 1.29±0.61 | 0.33c |
| Minimum MH(µm) ,mean±SD | 605.00±167.23 | 578.50±81.64 | 1c |
| Maximum MH(µm) ,mean±SD | 1202.78±442.21 | 987.50±547.40 | 0.91c |
| High myopia, n(%) | 2(14.29%) | 4(26.67%) | 0.18b |
| Follow-up time(month) ,mean±SD | 2.86±1.4 | 3.86±1.6 | 0.09c |
| Combined operation rate, n(%) | 8(57.14%) | 7(46.67%) | 0.34b |
Table 1: Preoperative baseline data outcomes
BCVA=best corrected visual acuity, log MAR=logarithm of the minimum angle of resolution, MH=macular hole
a T-test, bChi-square test, cMann-whitney U test
| Temporal Group | Classic Group | P value | |
| BCVA(log MAR) | 0.80±0.3 | 1.12±0.5 | 0.19c |
| Hole closure rate, n(%) | 14 (100%) | 14 (93.33%) | 1b |
| ELM/EZ recovery, n(%) | 10 (71.72%) | 8 (72.72%) | 0.05b |
| Macular contour: U+V-shaped, n(%) | 13 (92.86%) | 7 (53.85%) | 0.03b * |
| Complication, n(%) | 0 (0) | 5 (33.33%) | 0.001b** |
Table 2: Postoperative recovery status (last postoperative follow-up within 6 months)
Table 3: Changes in macular thickness before and after surgery (last postoperative follow-up within 6 months)
N=nasal T=temporal cMann-whitney U test
*=P<0.05 **=P<0.01
Tables at a glance