Table 1: Characteristic Comparison between the Two Populations.
Table 2
Test 1-2
Test 3-4
Test 1-3
Test 2-4
r
p
r
p
r
p
r
p
NPC
0.8
<0.001
0.7
<0.001
0.7
<0.001
0.7
<0.001
PFV
0.8
<0.001
0.9
<0.001
0.5
0.002
0.4
0.009
NFV
0.4
<0.001
0.1
0.533
0.2
0.366
0.02
0.91
Ocular deviation at distance
0.7
<0.001
0.7
<0.001
0.6
<0.001
0.7
<0.001
Near ocular deviation
0.7
<0.001
0.8
<0.001
0.8
<0.001
0.6
<0.001
Table 2: Spearman Correlation Analysis of EMAA Pro Application Tests and Their Repeatability and Reproducibility
Table 3
Measurements
Combination
ICC values
95% CI
P-values
NPC
Test 1 - Test 2
0.8
[0.69; 0.85]
<0.001
Test 3 - Test 4
0.8
[0.61; 0.86]
<0.001
PFV
Test 1 - Test 2
0.8
[0.70; 0.86]
<0.001
Test 3 - Test 4
0.9
[0.81; 0.93]
<0.001
NFV
Test 1 - Test 2
0.4
[0.25; 0.57]
<0.001
Test 3 - Test 4
0.2
[-0.13; 0.41]
0.18
Far ocular deviation
Test 1 - Test 2
0.7
[0.60; 0.80]
<0.001
Test 3 - Test 4
0.8
[0.68; 0.88]
<0.001
Near ocular deviation
Test 1 - Test 2
0.8
[0.74; 0.87]
<0.001
Test 3 - Test 4
0.7
[0.46; 0.79]
<0.001
Table 3: Intraclass Coefficient (Icc) of Repeatability of Emaa Pro Measurements
Table 4
Measurements
Combination
ICC values
95% CI
P-values
NPC
Test 1 - Test 3
0.8
[0.62; 0.86]
<0.001
Test 2 - Test 4
0.8
[0.63; 0.86]
<0.001
PFV
Test 1 - Test 3
0.6
[0.42; 0.76]
<0.001
Test 2 - Test 4
0.5
[0.23; 0.66]
0.002
NFV
Test 1 - Test 3
0.2
[-0.11; 0.43]
0.15
Test 2 - Test 4
0.1
[-0.15;0.39]
0.22
Far ocular deviation
Test 1 - Test 3
0.7
[0.59; 0.84]
<0.001
Test 2 - Test 4
0.7
[0.57; 0.84]
<0.001
Near ocular deviation
Test 1 - Test 3
0.6
[0.43; 0.77]
<0.001
Test 2 - Test 4
0.8
[0.60; 0.85]
<0.001
Table 4: Intraclass coefficient (ICC) of reproducibility of EMAA Pro measurements
Table 5
Mean ± SD
95% CI
Min; Q1; median; Q3; max
Stereo acuity (in seconds of arc)
150.6 ± 143
[116.6;184.7]
(30; 45; 90; 215; 500)
NPC (in centimeters)
10.5 ± 6.6
[9;12.1]
(5; 6.5; 8.4; 11.5; 35.5)
PFV (in prism diopters)
51.2 ± 21.6
[46;56.3]
(10; 35.3; 50.8; 70.4; 80)
NFV (in prism diopters)
-9.7 ± 3
[-10.5;-9]
(-17.5; -11.4; -9; -7.5; -4)
Ocular deviation at distance (in prism diopters)
0.6 ± 2.1
[0.1;1.1]
(-6.5; 0; 0; 0.5; 9)
Near ocular deviation (in prism diopters)
-9.6 ± 3.7
[-10.4;-8.7]
(-23; -12; -10.3; -7.3; 1)
Table 5: Excepted values of tests from EMAA Pro application
Tables at a glance
Table 1Table 2Table 3Table 4Table 5
Figures at a glance
Figure 1Figure 2Figure 3Figure 4
FIGURE 1
FIGURE 2
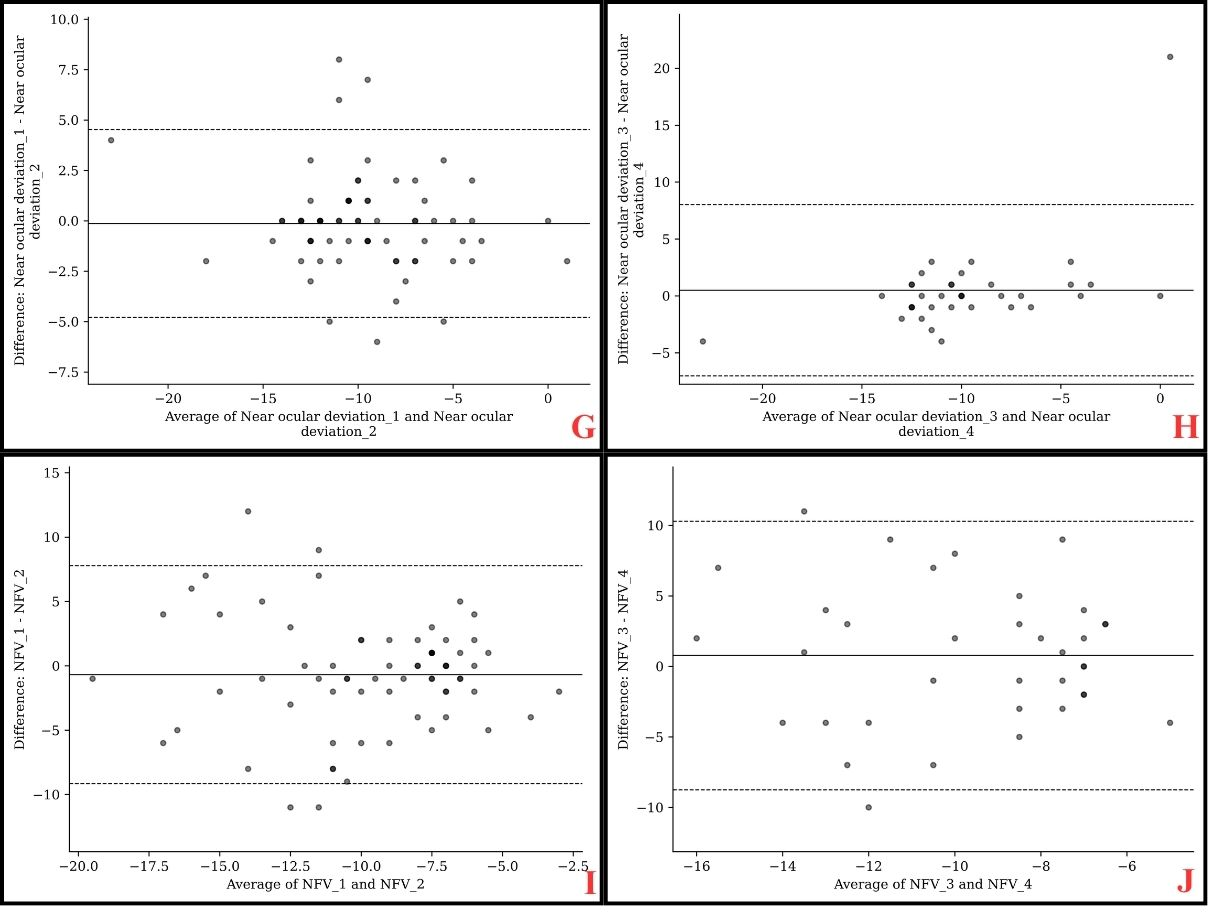
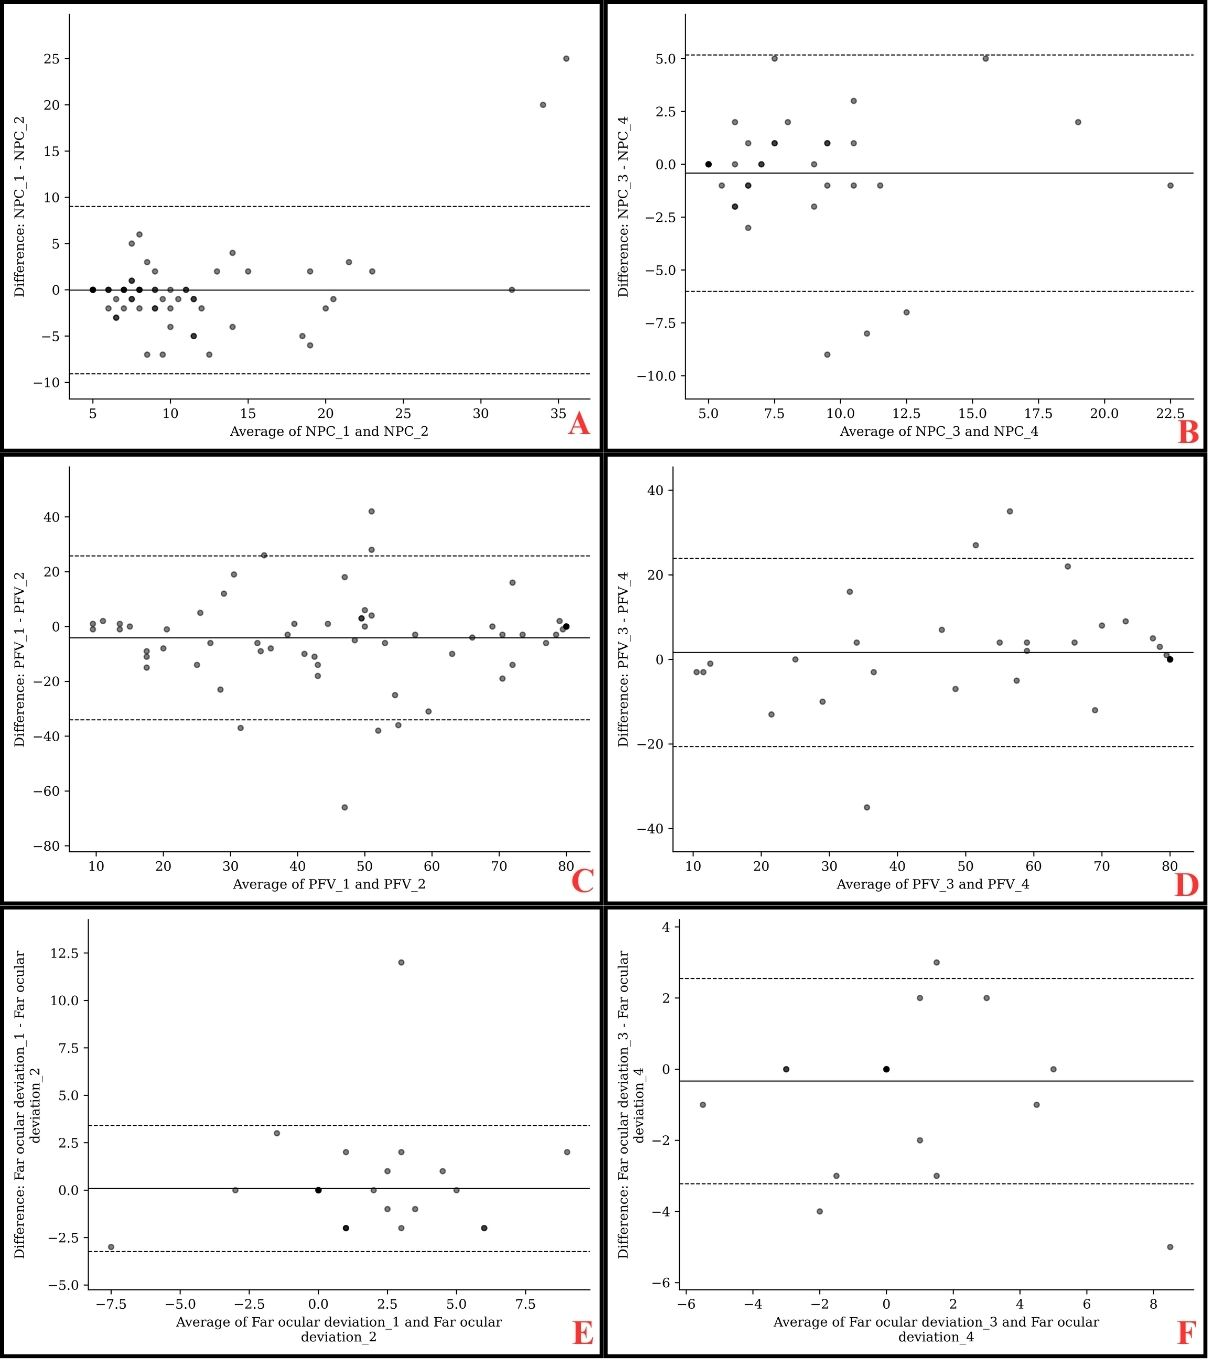
Figure 1: Bland-Altman plots comparing repeatability of EMMA measurements
A : NPC of Test 1-2 ; B : NPC of Test 3-4 ; C : PFV of Test 1-2 ; D : PFV of Test 3-4 ; E : Far ocular deviation of Test 1-2 ; F : Far ocular deviation of Test 3-4 ; G : Near ocular deviation of Test 1-2 ; H : Near ocular deviation of Test 3-4 ; I : NFV of Test 1-2 ; J : NFV of Test 3-4
FIGURE 3
FIGURE 4
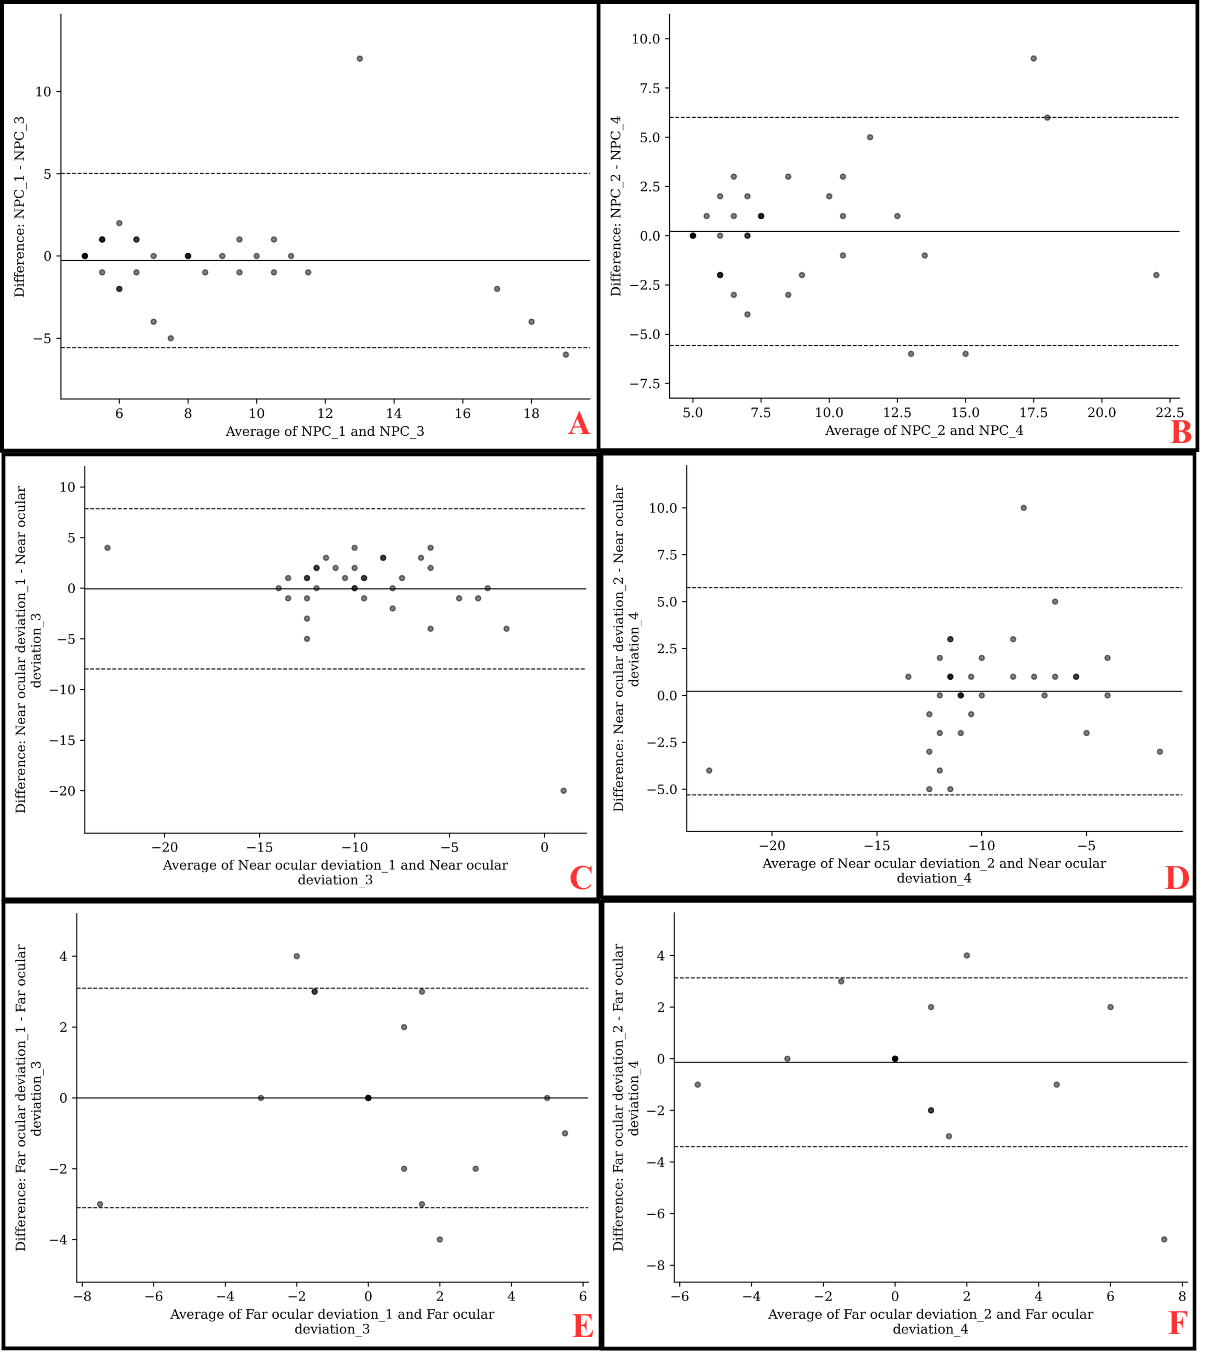
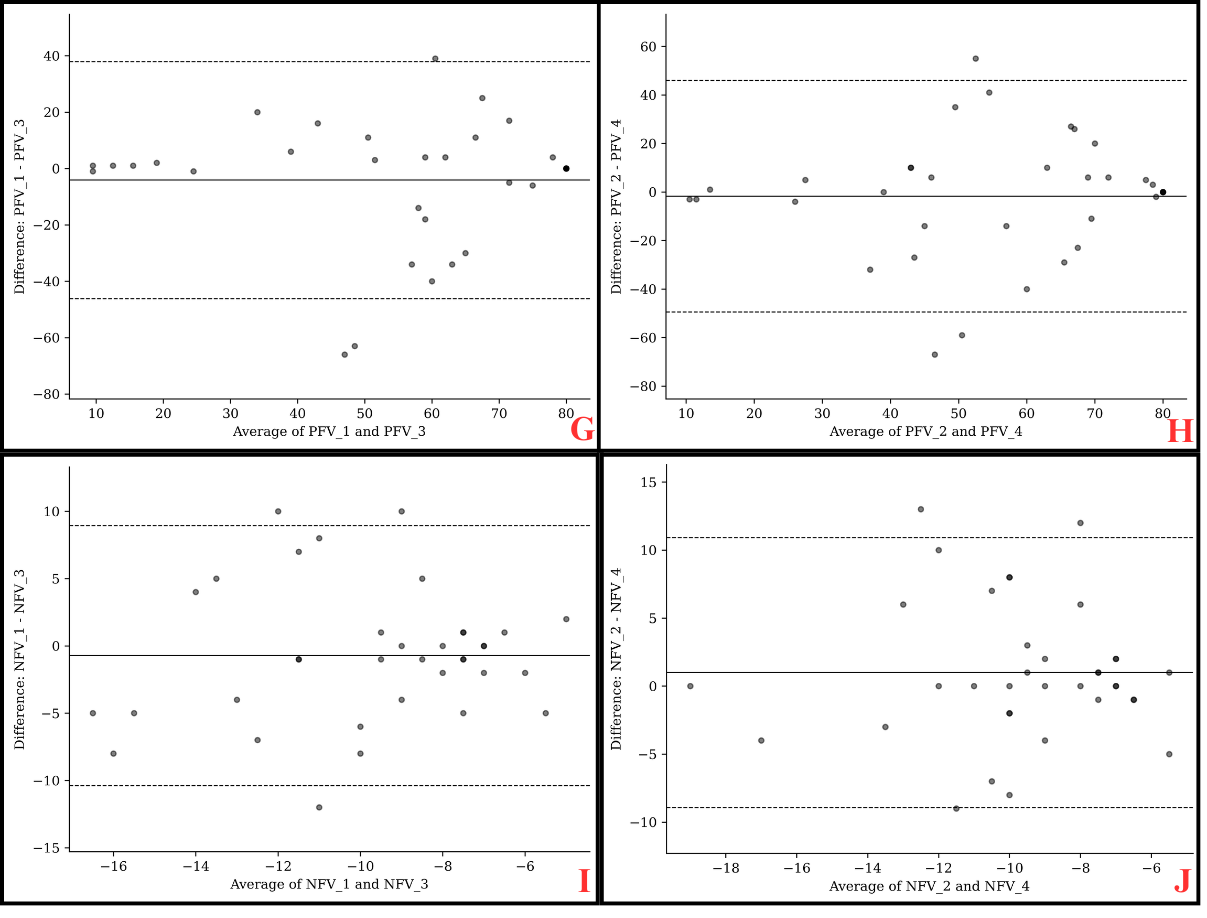
Figure 2: Bland-Altman Plots Comparing Repeatability of EMMA Measurements
A : NPC of Test 1-2 ; B : NPC of Test 3-4 ; C : Near ocular deviation of Test 1-2 ; D : Near ocular deviation of Test 3-4 ; E : Far ocular deviation of Test 1-2 ; F : Far ocular deviation of Test 3-4 ; G : PFV of Test 1-2 ; H : PFV of Test 3-4 ; I : NFV of Test 1-2 ; J : NFV of Test 3-4
Tables at a glance
Figures at a glance