
Figure1: Systematic Representation of Research Methodology
Figure1: Systematic Representation of Research Methodology
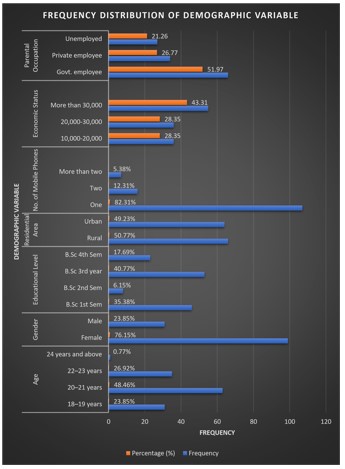
Figure 2: Bar Diagram Showing Frequency Percentage Distribution According to T=the Demographic Variables of Study Subject
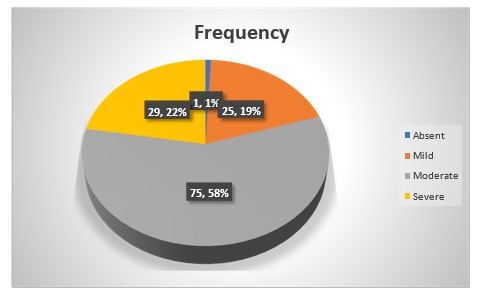
Figure 3: Bar Diagram Showing Frequency Percentage Distribution According to the Level of Nomophobia among Study Subject
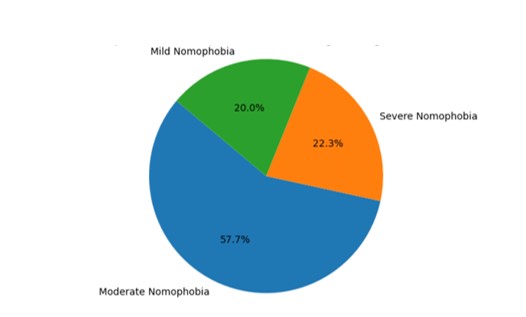
Figure 4: Proportion of Nomophobia Levels among Nursing Students
Tables at a glance
Figures at a glance