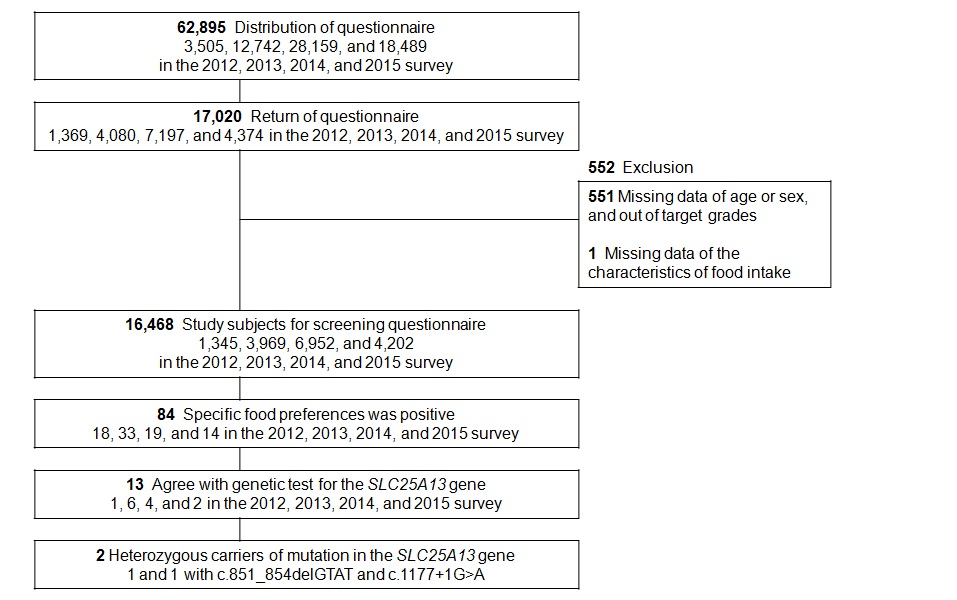
Figure 1:Outline of the study The genetic test of SLC25A13 examined the presence or absence of six kinds of mutations in the SLC25A13 gene: c.851_854delGTAT, c.1177+1G>A, c.1638_1660dup, c.674C>A, c.1230+1G>A, g.IVS16ins3kb.
Figure 1:Outline of the study The genetic test of SLC25A13 examined the presence or absence of six kinds of mutations in the SLC25A13 gene: c.851_854delGTAT, c.1177+1G>A, c.1638_1660dup, c.674C>A, c.1230+1G>A, g.IVS16ins3kb.
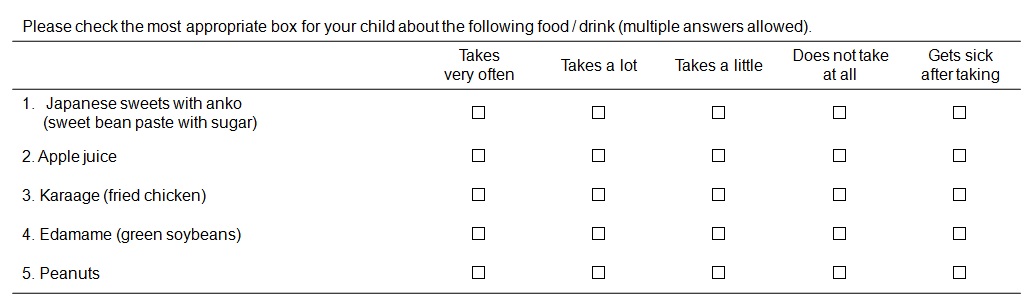
Figure 2:: Questionnaire for specific food preferences of the 2013 survey versionWe defined the specific food preferences of these five food items and birth weight according to the questionnaire.
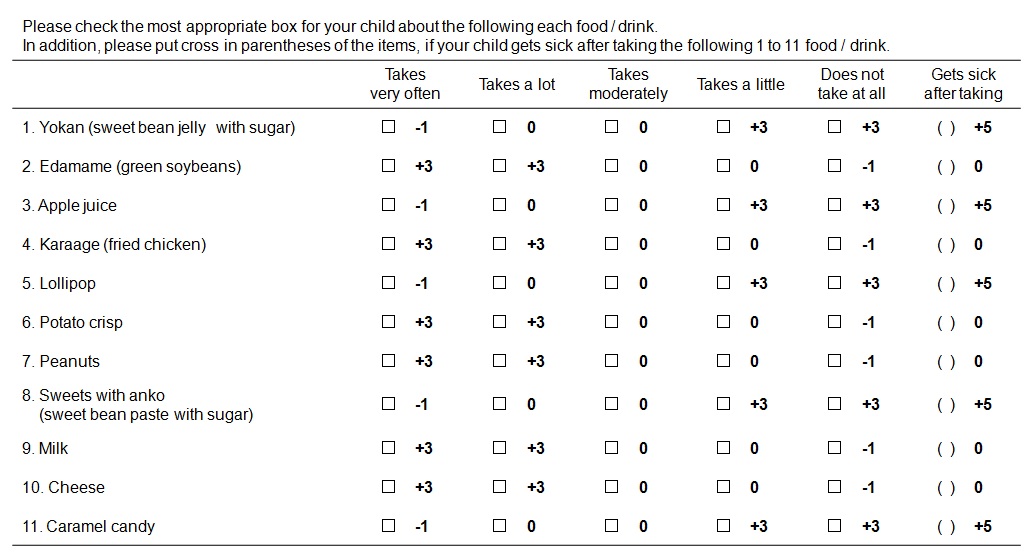
Figure 3:Questionnaire for specific food preferences of the 2014 and 2015 survey version. The numbers beside the boxes or parentheses are the scores for each answer. The scores were not shown in the real questionnaire. The total score was defined as the sum of the scores of the boxes and those of the parentheses for all 11 food items.
|
Total |
2012 survey |
2013 survey |
2014 survey |
2015 survey |
N |
16,468 (100.0) |
1,345 (100.0) |
3,969 (100.0) |
6,952 (100.0) |
4,202 (100.0) |
Grade 2nd |
4,451 (27.0) |
317 (23.6) |
1,098 (27.7) |
1,867 (26.9) |
1,169 (27.8) |
4th |
4,334 (26.3) |
358 (26.6) |
1,123 (28.3) |
1,815 (26.1) |
1,038 (24.7) |
6th |
4,336 (26.3) |
375 (27.9) |
1,014 (25.6) |
1,784 (25.7) |
1,163 (27.7) |
8th |
3,347 (20.3) |
295 (21.9) |
734 (18.5) |
1,486 (21.4) |
832 (19.8) |
Boys |
8,136 (49.4) |
642 (47.7) |
1,948 (49.1) |
3,422 (49.2) |
2,124 (50.6) |
History of hospitalization 4,845 |
(29.4) |
352 (26.2) |
1,432 (36.1) |
1,965 (28.3) |
1,096 (26.1) |
Birth weight, gram (N=14,849) |
3,026 � 450 |
No data |
3,027 � 432 |
3,023 � 457 |
3,030 � 457 |
Table1 Characteristics of the survey participants
Data are expressed as number (%) in categorical variable and mean � standard deviation in continuous variable. History of hospitalization was defined hospitalization from any reason. Birth weight was not considered by gestational age.
No. |
Sex |
Age, y |
Birth weight, gram*1 |
BMI,kg/m2 |
Easily fatigued |
Neonatal jaundice*2 |
Poor hepatobiliary function*3 |
Survey year |
Total score of questionnaire about food preferences*4 |
Gene mutation*5 |
1 |
Girl |
15 |
3,100 |
18.8 |
Yes |
No |
No |
2012 |
NA |
Hetero [I] |
2 |
Girl |
13 |
2,600 |
16.8 |
No |
No |
No |
2013 |
NA |
No |
3 |
Girl |
10 |
2,900 |
18.1 |
No |
No |
No |
2013 |
NA |
No |
4 |
Boy |
14 |
2,200 |
14.5 |
No |
No |
No |
2013 |
NA |
No |
5 |
Boy |
8 |
2,900 |
14.5 |
No |
Yes |
No |
2013 |
NA |
No |
6 |
Girl |
9 |
2,500 |
15.3 |
No |
Yes |
No |
2013 |
NA |
No |
7 |
Boy |
10 |
2,200 |
15.9 |
No |
Yes |
Yes |
2013 |
NA |
No |
8 |
Girl |
15 |
3,300 |
24.7 |
No |
No |
No |
2014 |
31 |
No |
9 |
Girl |
9 |
3,600 |
26.9 |
No |
No |
No |
2014 |
42 |
No |
10 |
Boy |
15 |
3,100 |
28.2 |
Yes |
Yes |
No |
2014 |
33 |
Hetero [II] |
11 |
Boy |
13 |
3,500 |
18.9 |
No |
No |
No |
2014 |
28 |
No |
12 |
Girl |
8 |
1,700 |
13.4 |
No |
Yes |
No |
2015 |
30 |
No |
13 |
Boy |
8 |
2,600 |
16.5 |
No |
No |
No |
2015 |
30 |
No |
Table2 PCR results and characteristics of the genetic test participants
*1 Birth weight was rounded to the nearest 100 and was not considered by gestational age. *2 Prolonged or sever symptom of neonatal jaundice or phototherapy for neonatal jaundice. *3 Poor hepatobiliary function in the neonatal period. *4 Total score was defined as sum of the point of the boxes and those of the parentheses for all the 11 food items in Fig. 3. *5 Mutation in the SLC25A13 gene. Hetero [I] and hetero [II] indicates heterozygous mutation of c.851_854delGTAT, and that of c.1177 + 1G>A, respectively.