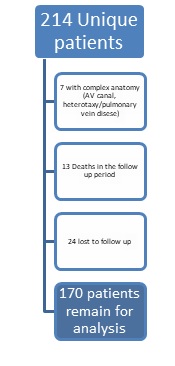
Eligible Participants
Eligible Participants
Diagnosis |
Number with diagnosis |
Number of Tested (%) |
Number of patients tested with diagnosis of 22q11 (%) |
TOF/PS |
126 |
69 (55%) |
11 (16%) |
TOF/ absent valve |
5 |
3 (60%) |
2 (75%) |
IAA Type B |
7 |
6 (86%) |
5 (83%) |
IAA type A |
2 |
2 (100%) |
0 (0) |
Truncus |
10 |
8 (80%) |
2 (25%) |
TOF/ PA |
20 |
16 (80%) |
4 (25%) |
Total |
170 |
104 (61%) |
24 (23%) |
Table 1: Demographics of Patients Included in Analysis
Diagnosis |
Number of patients tested for 22q11 deletion |
Number of patients with genetics consult |
Number of patients with genetics consult who had testing |
TOF/PS |
69 |
53 (77%) |
46 (67%) |
TOF/ absent valve |
3 |
2 (67%) |
2 (67%) |
IAA Type B |
6 |
5 (83%) |
5 (83%) |
IAA type A |
2 |
1 (50%) |
1 (50%) |
Truncus |
8 |
8 (100%) |
7 (88%) |
TOF/ PA |
16 |
10 (63%) |
10 (63%) |
Total |
104 |
79 (76%) |
71 (68%) |
Table 2. Relationship between genetics consultation and testing for 22q11 deletion
Diagnosis |
Number of pre-op admits |
Number of pre-op admits who had testing |
TOF/PS |
59 |
45 (76%) |
TOF/ absent valve |
5 |
3 (60%) |
IAA Type B |
7 |
6 (86%) |
IAA type A |
2 |
2 (100%) |
Truncus |
10 |
8 (80%) |
TOF/ PA |
19 |
16 (84%) |
Total |
102 |
80 (78%) |
Table 3. Association between pre-operative admissions and testing for 22q11 deletion