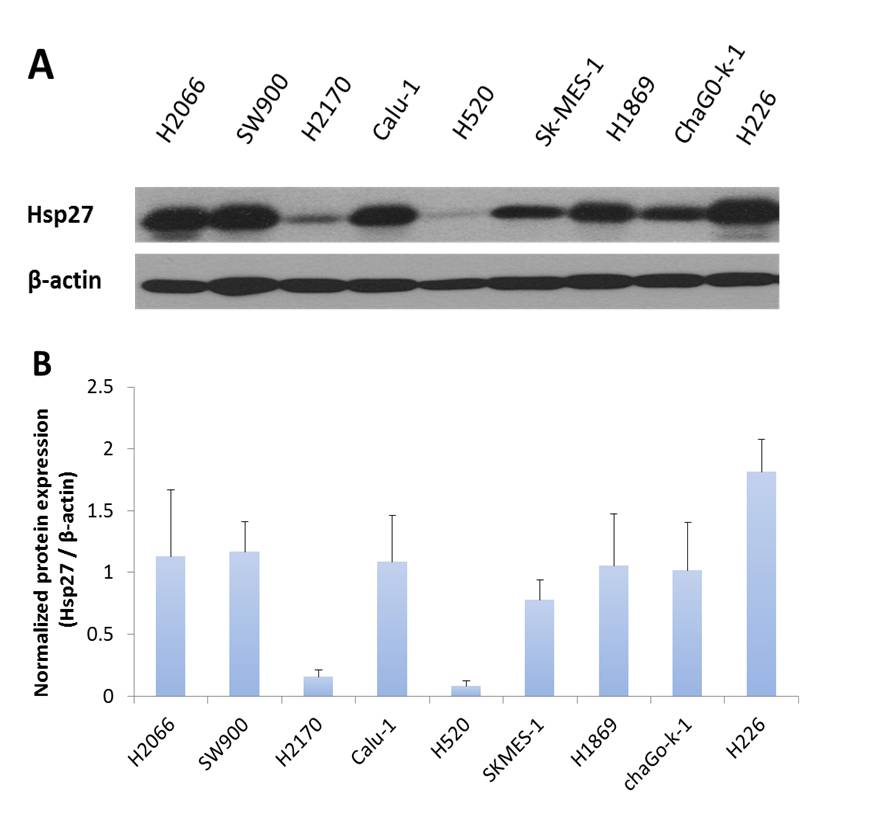
Figure 1 Western blot analysis of Hsp27 in nine non-small cell lung squamous cell carcinoma cell lines. (A) Basal expression levels of Hsp27 from the nine SCC cell lines were detected. Whole cell lysates (15 µg) were resolved on SDS-PAGE gel and probed with goat anti-Hsp27 polyclonal primary antibody for western blot analysis. ß-actin was used as loading control. (B) Quantitative analysis of Hsp27 expression was performed by normalizing Hsp27 protein expression against ß-actin.

Figure 2 IC50 values for the anti-proliferative activity of a panel of chemotherapeutic drugs against H520, Calu-1 and H226 cells. IC50 values of cisplatin, 5-FU, docetaxel (A) and carboplatin (B) were assessed using MTS assay. IC50 was compared using the high Hsp27 expression cell line (Calu-1 and H226) against the low Hsp27 expression cell line (H520). Values are expressed as mean ± SD (n=3); (**) indicates significant difference, p < 0.01.

Figure 3 Silencing of Hsp27 expression in Calu-1 and H226 cell lines using siRNA transfection. (A) Western blot analysis of control, scrambledtreated and Hsp27 siRNA-treated Calu-1 and H226 cells was performed. The cells were harvested 24 hours post-transfection. Whole cell lysates (15 µg) were resolved on 10% SDS-PAGE gel and probed with goat anti-Hsp27 polyclonal primary antibody for western blot analysis. ß-actin was used as a loading control. (B) Percentage inhibition of Hsp27 expression after normalizing Hsp27 protein expression against ß-actin. Values are expressed as mean ± SD (n=3).

Figure 4Effects of Hsp27 silencing on drug sensitivity of Calu-1 and H226 cells to carboplatin. Each cell line was treated with increasing concentrations of carboplatin for 72 hours. IC50 values were measured using MTS assay as described in materials and methods. Values are expressed as mean ± SD (n=3).

Figure 5 Effects of Hsp27 silencing on anchorage-dependent and -independent growth of Calu-1 and H226 cell lines. Cells were seeded on six-well plate at a density of 500 cells per well and cell colony size formation was determined after 14 days and 21 days for anchorage-dependent and –independent growth assays, respectively. (A) and (C) Representative photographs of crystal violet-stained colonies of scrambled-treated and Hsp27 siRNA-treated Calu-1 and H226 under the light microscope, 4x magnification. (B) and (D) Quantification of colonies formation for scrambled-treated and Hsp27 siRNA-treated Calu-1 and H226 was expressed as percentage of control cells (100%). Values are expressed as mean ± SD (n=3); (*) indicates significant difference, p < 0.05; (**) indicates significant difference, p < 0.01.

Figure 6 Percentage wound closure of scrambled-treated and Hsp27 siRNA-treated Calu-1 (C) and H226 cells (D) respectively, measured at each time interval with respect to 0 h (0%). Values are expressed as mean ± SD (n=3).

Figure 7 Effects of Hsp27 silencing on invasion capability of Calu-1 cells. The number of invaded cells was counted after 48 hours incubation at 37°C. Representative photographs of invaded cells across Matrigel membrane for (A) scrambled-treated and Hsp27 siRNA-treated Calu-1 under the light microscope, 4x magnification; (B) Number of invaded cells for scrambledtreated and Hsp27 siRNA-treated Calu-1 was expressed as percentage of control cells (100%). Values are expressed as mean ± SD(n=3).