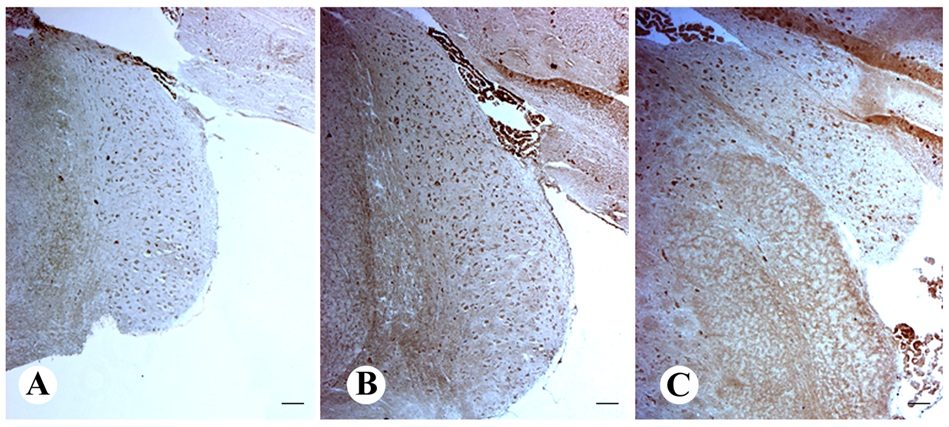
Figure 1 CB1 receptor immunoreactivity in the rat cochlear nuclei. From [30] with permission from Elsevier.
Figure 1 CB1 receptor immunoreactivity in the rat cochlear nuclei. From [30] with permission from Elsevier.
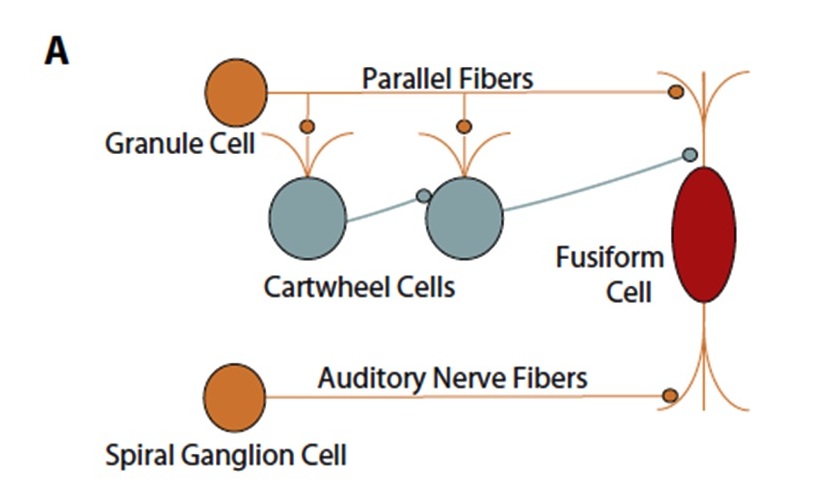
Figure 2 Circuitry of the DCN. From [43] with permission from Elsevier.
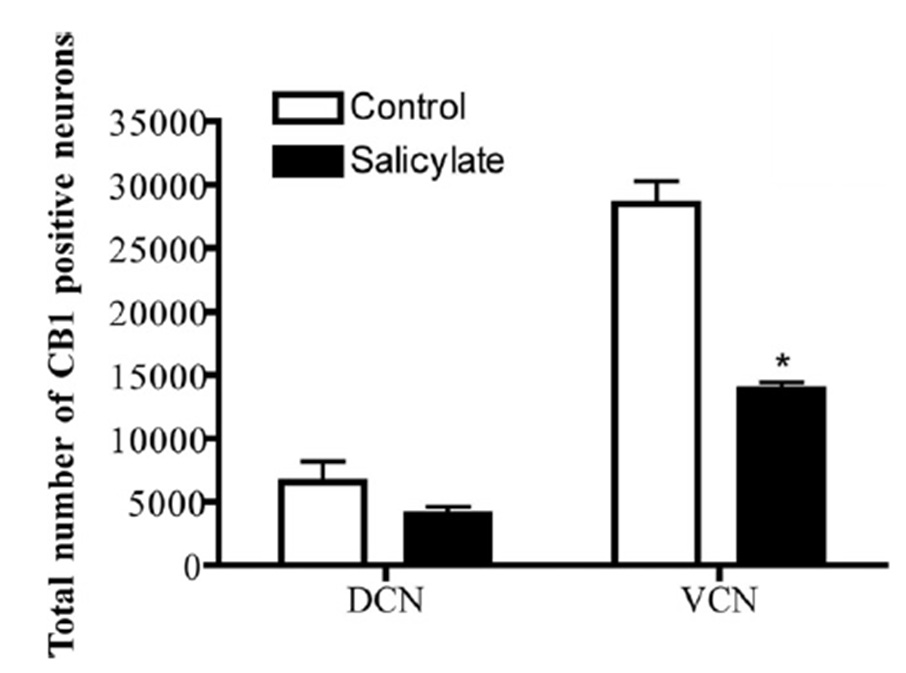
Figure 3 Down-regulation of CB1 receptor-positive neurons in the dorsal and ventral cochlear nuclei (DCN and VCN) in control (open bars) and salicylate- treated (filled bars) rats. Data are expressed as means and bars as 1 SEM. * P < 0.01 compared to the control group. From [30] with permission from Elsevier.
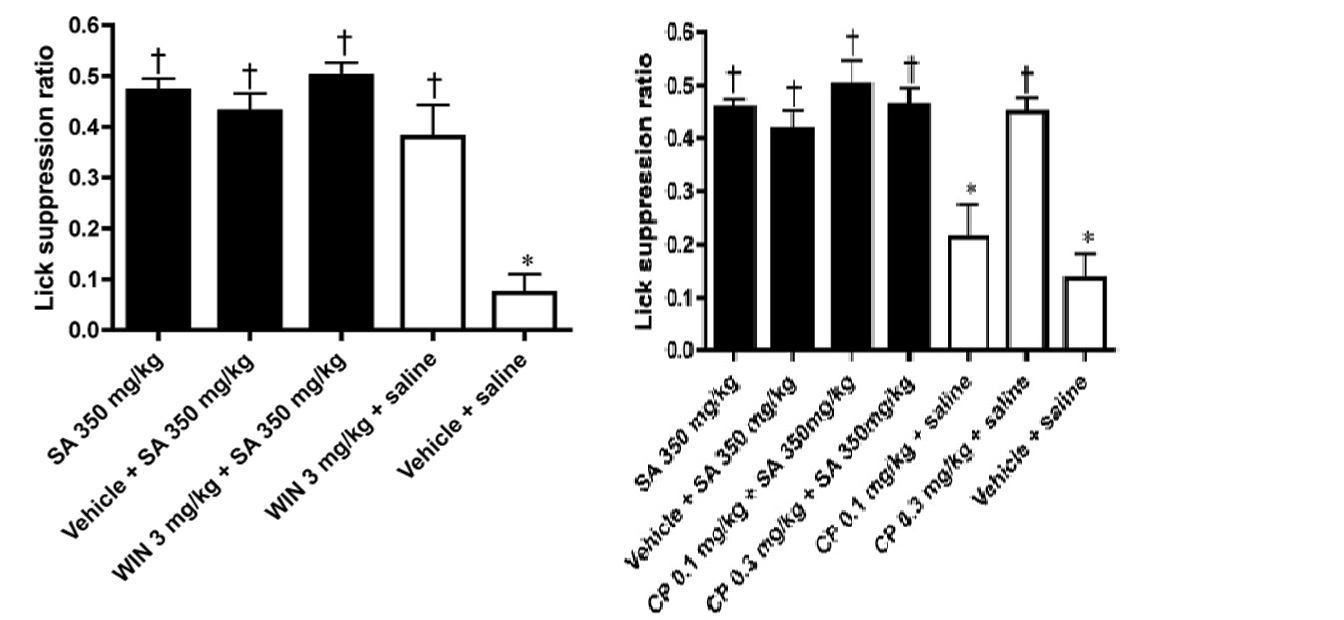
Figure 4 Top: Effects of salicylate (SA, 350 mg/kg) on the lick suppression ratio (SR) in an animal model of tinnitus compared to the effects of SA + vehicle, WIN55,212-2 (3 mg/kg) + SA, WIN55,212-2 (3 mg/kg) + saline and vehicle + saline. SA significantly increased the SR compared to vehicle + saline and WIN55,212-2 + SA did not decrease it. However, WIN55,212-2 + saline significantly increased the SR without SA. . * p< 0.05, vehicle + saline compared with SA 350 mg/kg; † p < 0.05, each group compared with vehicle + saline. Bottom: Effects of salicylate on the SR compared to the effects of SA + vehicle, CP55,940 (0.1 mg/kg) + SA, CP55,940 (0.3 mg/kg) + SA, CP55,940 (0.1 mg/kg) + saline, CP55,940 (0.3 mg/kg) + saline and vehicle + saline. SA significantly increased the SR compared to vehicle + saline and CP55,940+ SA did not decrease it. However, CP55,940 (0.3 mg/kg) + saline significantly increased the SR without SA. Bars represent means ± SE.* p < 0.05, vehicle + saline compared with SA 350 mg/kg; † p < 0.05, each group compared with vehicle + saline. From [42] with permission from Elsevier.