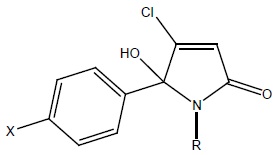
Figure 1 CCK –gastrin antagonists.
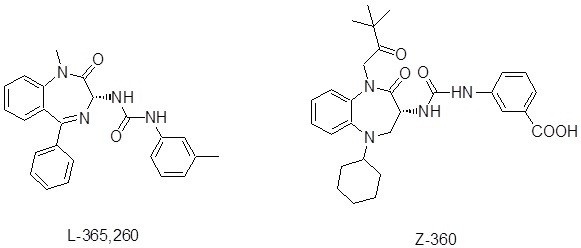
Figure 1 CCK –gastrin antagonists.
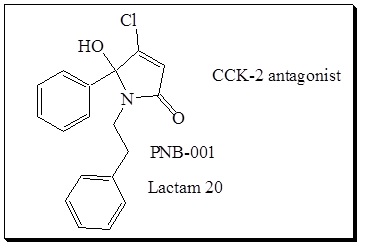
Figure 2 Chemical structure of CCK2 gastrin antagonist PNB-001, a potent anti-inflammatory analgesic.
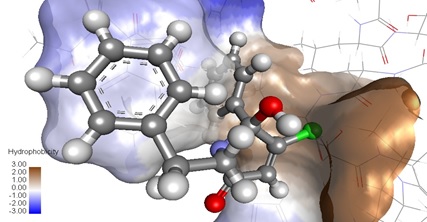
Figure 3 Docking of CCK antagonist PNB-001 into the CCK2 receptor.
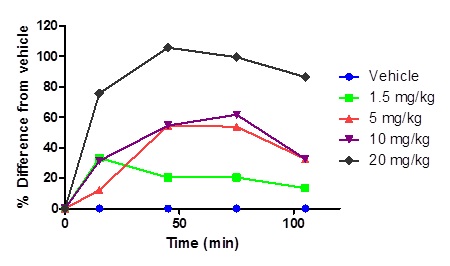
Figure 4 Dose range of PNB-001 in the tail immersion test by PO administration using rats.
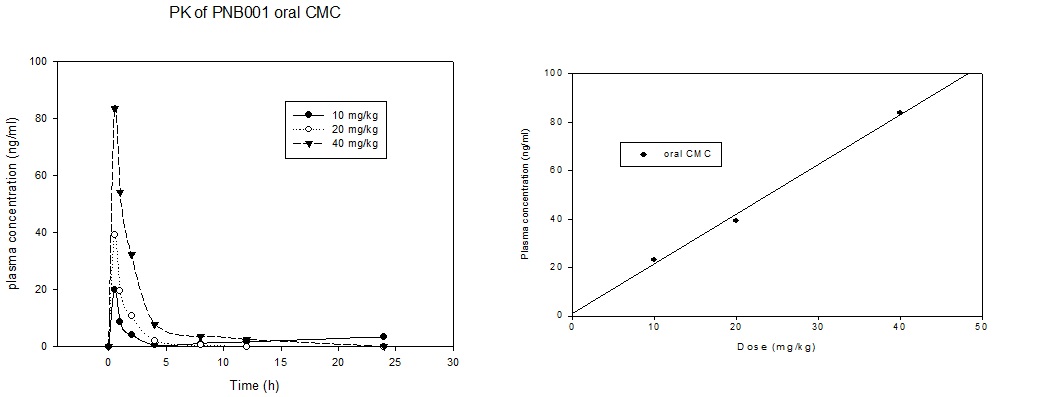
Figure 5 5a. PK analysis of PNB-001 in rats by oral administration. 5b. Linear pharmacokinetics of PNB001 in rats in the active dose range.
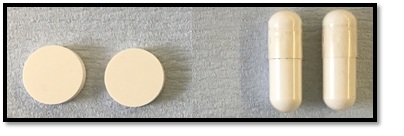
Figure 6PNB001 50 mg tablets versus 50 mg capsules.
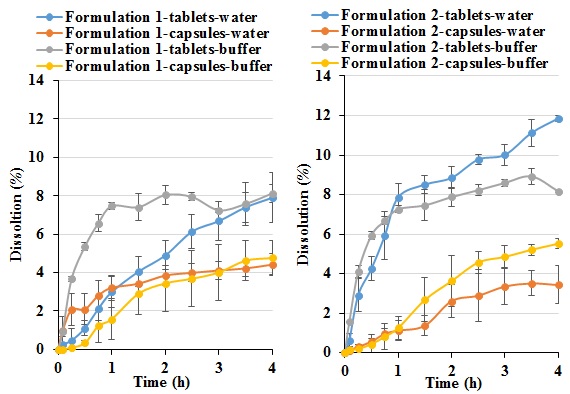
Figure 7 Dissolution profiles of the two formulations under investigation formulated into tablet or capsule solid forms dissolved in either de-ionised water or phosphate buffer (pH 6.8) media.
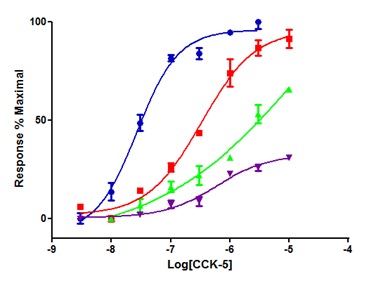
Figure 8 Responses to CCK-5 in the absence and presence of PNB-001, using the rat duodenum assay; CCK-5, CCK-5 +10 nM PNB-001, CCK-5 +30 nMPNB-001, CCK-5 + 100 nM PNB-001; N = 2 for each data point.
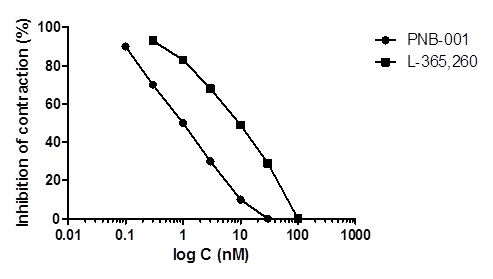
Figure 9 The inhibitory concentration-response curves of PNB-001 and L-365,260 (standard) for DSS stimulated contractions using the rat duodenum.
Lactam |
X= |
R= |
CCK1 |
CCK2 |
PNB-001 |
H |
Phenylethyl- |
>10 |
0.022±0.002 |
Lorglumide |
|
0.17±0.01 |
>10 |
|
L-356,260 |
0.25±0.01 |
0.003±0.001 |
||
Table1 CCK binding affinity expressed in IC50 in micromolar using iodinated hot CCK8 as radioligands with cortex and pancreatic membranes; N=3.
Material |
Function |
F1(g) |
F2(g) |
PNB001 |
Drug |
1.6 |
1.6 |
Crospovidone |
Disintegrant |
||
Corn Starch |
Disintegrant/ |
||
Wheat Starch |
Disintegrant/ |
4.32 |
4.32 |
Icing Sugar |
Diluent |
5.616 |
4.32 |
|
Diluent/ |
4.32 |
5.616 |
|
Lubricant |
0.144 |
0.144 |
Table2 Various placebo batches and test formulations (F1 and F2) under investigation.
Product |
Disintegration (min) |
Formulation 1 |
42.1 ± 2.8 |
Formulation 2 |
12.2 ± 0.4 |
Table3 Disintegration times of various placebo batches and test formulations under investigation (mean ± SD, n = 3).
Formulation |
Dosage form |
Dissolution medium |
DE (%) |
MDT (min) |
MDR (%min-1) |
f2 |
Formulation 1 |
Tablet |
Water |
4.65±0.79 |
1.64±0.07 |
2.14±0.79 |
76.2 |
Buffer |
6.95±0.34 |
0.58±0.08 |
4.00±0.07 |
|||
Capsule |
Water |
3.47±0.56 |
0.87±0.12 |
2.29±0.74 |
91.6 |
|
Buffer |
2.88±0.96 |
1.63±0.41 |
1.17±0.34 |
|||
Formulation 2 |
Tablet |
Water |
8.32±0.43 |
1.19±0.11 |
4.46±0.41 |
86.1 |
Buffer |
7.38±0.26 |
0.39±0.12 |
4.40±0.05 |
|||
Capsule |
Water |
2.15±0.62 |
1.49±0.28 |
0.95±0.28 |
91.1 |
|
Buffer |
3.17±0.51 |
1.71±0.30 |
1.34±0.05 |
Table4 Dissolution efficiency (DE), mean dissolution time (MDT) and mean dissolution rate (MDR) (mean ± SD, n = 3) for the two formulations under investigation formulated in a tablet or capsule solid form dissolved in either water or buffer (pH 6.8) media.