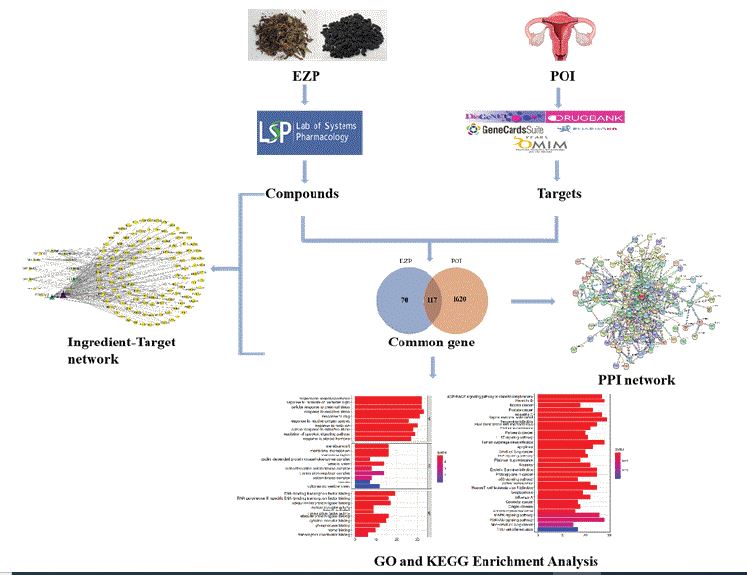
Figure 1: Whole framework based on network pharmacology
Figure 1: Whole framework based on network pharmacology
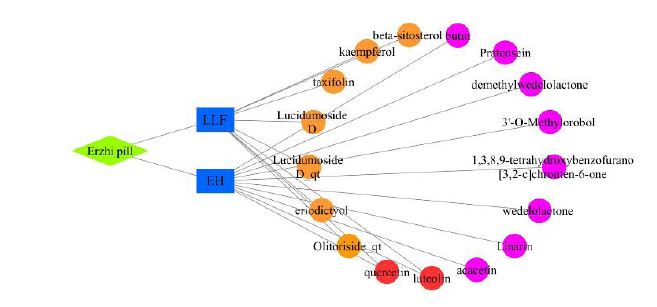
Figure 2: Active Ingredients of EZP: orange represents LLF, pink represents EH, and red represents the same active ingredients
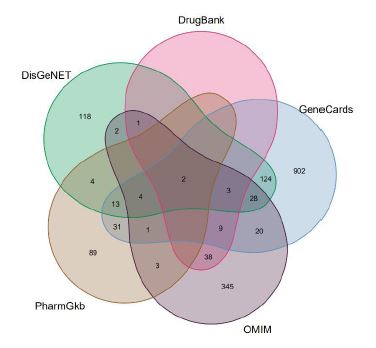
Figure 3: POI gene prediction analysis
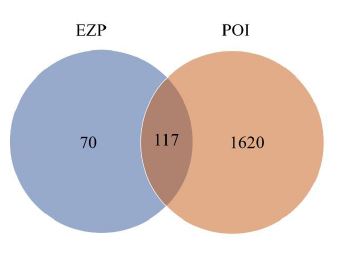
Figure 4: the common targets of EZP and POI

Figure 5: Drug active ingredients and disease target network
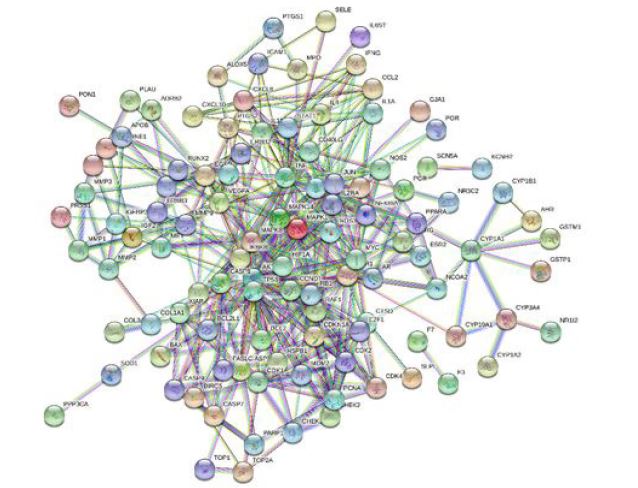
Figure 6: Protein-Protein interaction network

Figure 7: Process of topological screening for the PPI network
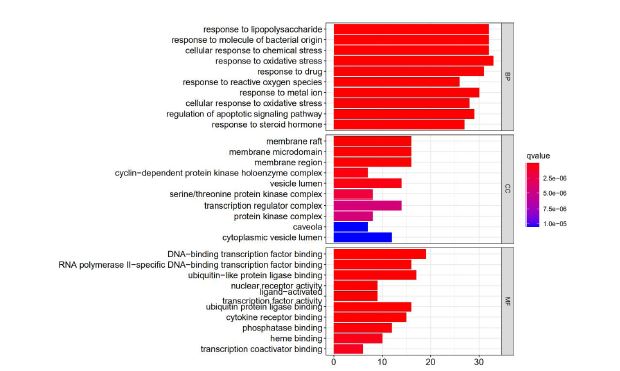
Figure 8: GO enrichment of EZP active components in the treatment of common targets of POI
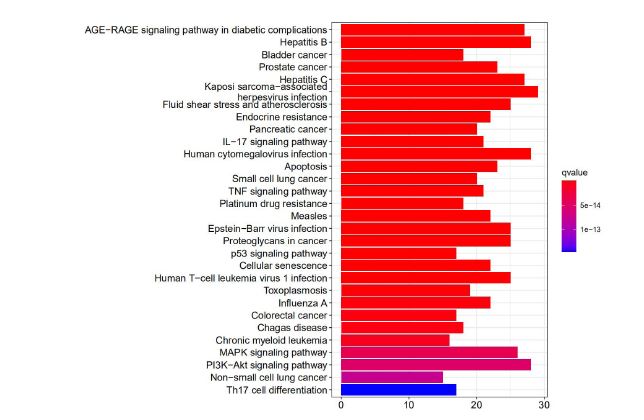
Figure 9: Enriched KEGG pathways of potential targets for treating POI from the main active ingredients of EZP
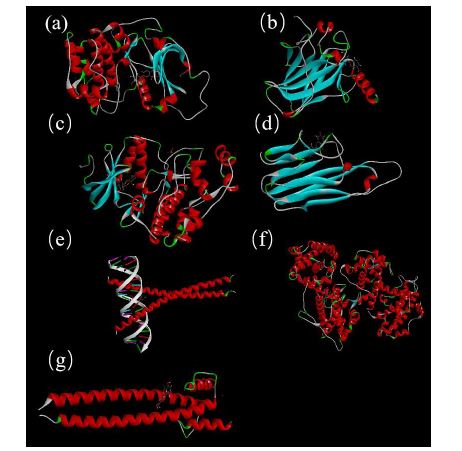
Figure 10: Molecular docking of compounds with core targets. (a) Docking process of quercetin with AKT1; (b) Docking process of quercetin with TP53; (c) Docking process of quercetin with MAPK1; (d) Docking process of quercetin with TNF; (e) Docking process of quercetin with JUN; (f) Docking process of quercetin with RB1; (g) Docking process of quercetin with MYC
Figures at a glance