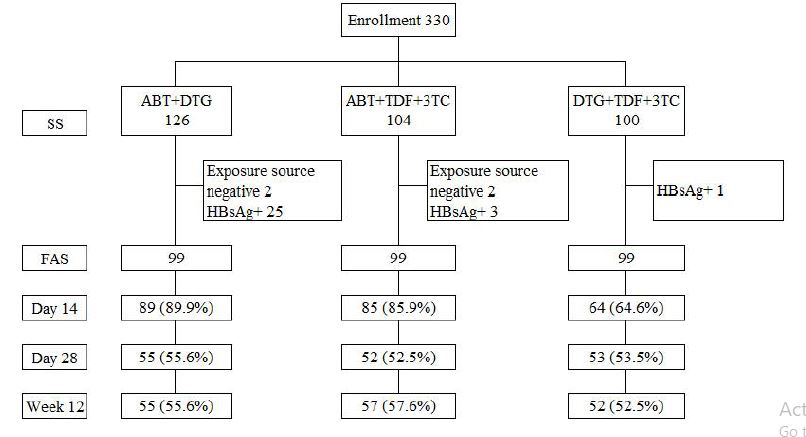
Figure 1: Distribution of subjects in the study
| Age. years | 31.58±8.82 | 32.02±8.71 | 31.66±9.13 | 31.07±8.67 |
| Male | 259 (87.2) | 85 (85.9) | 88 (88.9) | 86 (86.9) |
| Ethnicity | ||||
| Chinese - Han | 249 (92.2) | 91 (92.9) | 90 (90.9) | 68 (93.2) |
| Other | 21 (7.8) | 7 (7.1) | 9 (9.1) | 5 (6.8) |
| Height (cm) | 171.3±6.6 | 171.6±7 | 170.8±6.1 | 171.4±6.8 |
| Weight (kg) | 67.7±10.7 | 68.4±!0.3 | 67.8± 10.9 | 66.9± 10.9 |
| BM!(kg/m2) | 23±3 | 23.2±2.9 | 23.2±3.l | 22.7±3 |
| Hepatitis C Ab (+) | 1 (0.4) | 1( l.l) | 0 (0.0) | 0 (0.0) |
| TP-Ab (+) | 6 (2.2) | 3 (3.4) | 0 {0.0) | 3 (3.3) |
| Mode of Exposure | ||||
| Occupational Exposure | 8(2.7) | 2(2.0) | 5(5.1) | 1(1.0) |
| Sexual exposure | 270(9 1.9) | 90(90.9) | 88(88.8) | 92(95.9) |
| Unknown | 9(3. 1) | 3(3.0) | 1(1.0) | 5(5.2) |
| Anal sex | 55 (18.7) | 9 (9. l) | 16 (16.2) | 30 (31.3) |
| Vaginal intercourse | 183 (62.2) | 70 (70.7) | 59 (59.6) | 54 (56.3) |
| Oral sex | 23 (7.8) | 8 (8.l) | 12 (12.1) | 3 (3.1) |
| Blood/body fluid exposure | 16 {5.4) | 7 (7.l) | 6 (6.1) | 3 (3.1) |
| Exposure time | ||||
| Average exposure time (h) | 26.8±19.5 | 28.0±19.1 | 26.0± 19.7 | 26.5± 19.9 |
| ≤24 h (, %) | 163(56.0) | 51(51.5) | 57(58.2) | 55(58.5) |
| 24-48h | 80(27.5) | 30(30.3) | 27(27.6) | 23(24.5) |
| 48-72h | 44(15.l) | 17(17.2) | l 4( 14.3) | 13( 13.8) |
| >72 h | 4( 1.4) | 1(1.0) | 0(0.0) | 3(3.2) |
Data are n (%) and mean ± SD.
Table 1 : Demographic Data and Baseline Characteristics (FAS)
| Completion rate n(%) | Total (N=297) | Group 1 (ABT+DTG) (n=99) |
Group 2 (ABT+TDF+3TC) (n=99) |
Group 3 (TDF+3TC+DTG) (n=99) |
| 1st infusion of ABT | J 98 (I00.0) | 99 (I00.0) | 99 {100.0) | - |
| 2nd iofusions of ABT | 176 (88.9) ** | 91 (91.9)** | 85 (85.9)** | - |
| Oral medication for 14 days | 256 (86.2) | 91 (91.9)* | 85 {85.9) | 80 {80.8) |
| oral medication for 28 davs | 190 (64.0) | 63 (63.6) | 64 {64.6) | 63 (63.6) |
*P<0.05 (vs. Group 3); **P<0.0001 (vs. oral medication)
Table 2 : Preventive Drug Completion Rates (FAS)
| Adherence Mean±SD (%} | Total (N=297) | Group 1 (ABT+DTG) (n=99) |
Group 2 (ABT+TDF+3TC) (n=99) |
Group 3 (TDF+3TC+DTG) (n=99) |
| ABT | 94.4±15.8** | 96.0±13.7** | 92.9±17.5** | - |
| Oral medication | 75.7±36.0 | 78.6±32.l | 75.5± 36.5 | 72.9± 39.2 |
| Combination | 80.5 ±3l .4* | 87.3±21.5* | 81.3± 29.4 | 72.9± 39.2 |
*: P<0.01 (vs. all 3 groups or vs. Group 3); **P<0.0001 (vs. oral medication)
Table 3 : Preventive Drug Adherence (FAS)
| Total N=330 |
Group 1 n= l26 |
Group 2 n= 104 |
Group 3 n= 100 |
|
| AE | 100(30.3) | 36 (28.6) | 36(34.6) | 28(28.0) |
| AE Grade | ||||
| Case | 145(43.9) | 54(42.9) | 49(47.1) | 42(42.0) |
| Grade 1-2 | 144(99.3) | 54(100.0) | 48(98.0) | 42( 100.0) |
| Grade 3-4 | 1(0.7) | 0(0.0) | 1(2.0) | 0(0.0) |
| Neurological diseases | 31(9.39) | 11(8.73) | 10(9.62) | 10(10.00) |
| Dizziness | 25(7.58) | 10(7.94) | 8(7.69) | 7 (7.00) |
| Drowsiness | 5( 1.52) | 1(0.79) | 2( 1.92) | 2(2.00) |
| Headache | 1(0.30) | 0(0.00) | 0(0.00) | 1(1.00) |
| Gastrointestinal diseases | 27(8.18) | 11(8.73) | 8(7.69) | 8(8.00) |
| Diarrhea | 15(4.55) | 8(6.35) | 5(4.81) | 2(2.00) |
| Nausea | 9(2.73) | 3(2.38) | 2( 1.92) | 4(4.00) |
| Vomiting | 2(0.61) | 0(0.00) | 1(0.96) | 1(1.00) |
| Upper abdominal pain | 1(0.30) | 0(0.00) | 0(0.00) | 1(1.00) |
| Total N=330 |
Group 1 n= l26 |
Group 2 n= 104 |
Group 3 n = lOO |
|
| System ic diseases and Application site Reaction | 26(7.88) | 10(7.94) | 9 (8.65) | 7 (7.00) |
| Fatigue | 15(4.55) | 6(4.76) | 4(3.85) | 5(5.00) |
| Fever | 5(1.52) | 2 (1.59) | 2(1.92) | 1(1.00) |
| Hot | 4(1.21) | 1 (0.79) | 2( 1.92) | 1(1.00) |
| Pai n | 1(0.30} | 0 (0.00) | l(0.96) | 0(0.00) |
| Chest discomfort | 1(0.30) | 1 (0.79) | 0(0.00) | 0(0.00) |
| Lab testinl! | 26(7.88) | 10(7.94) | 4(3.85)' | 12(12.00) |
| Elevated blood triglycerides | 14(4.24) | 5(3.97) | 2( 1.92) | 7(7.00) |
| Elevated blood uric acid | 5(1.52) | 2( l.59) | l(0.96) | 2(2.00) |
| Elevated y-glutamine transferase | 2(0.61) | 1(0.79) | 0(0.00) | 1(1.00) |
| Elevated Alanine amino transferase | 1(0.30) | 0(0.00) | 0(0.00) | 1(1.00) |
| Positive urinary red blood cells | 1(0.30} | 1 (0.79) | 0(0.00) | 0(0.00) |
| Elevated blood bilirubin | 1(0.30) | 0(0.00) | 0(0.00) | 1(1.00) |
| Elevated blood creatinine | 1(0.30) | 0(0.00) | l(0.96) | 0(0.00) |
| Elevated blood glucose | 1(0.30) | 1(0.79) | 0(0.00) | 0(0.00) |
| Liver and bile system disease | 8(2.42) | 2( 1.59) | 5(4.81) | 1( 1.00) |
| Abnormal liver function | 8(2.42) | 2( l.59) | 5(4.81) | 1(1.00) |
| Respiratory, chest and estranged diseases | 6(1.82) | 4(3.l7) | 2( 1.92) | 0(0.00) |
| Pain in the mouth and throat | 5(1.52) | 4(3.17) | 1(0.96) | 0(0.00) |
| Throat discomfort | l(0.30) | 0(0.00) | l(0.96) | 0(0.00) |
| Metabolic and nutritional diseases | 5(1.52) | 2( 1.59) | 3(2.88) | 0(0.00) |
| Anorexia | 5(1.52) | 2( 1.59) | 3(2.88) | 0(0.00) |
| Skin and subcutaneous tissue diseases | 5(1.52) | 2( l.59) | 2( l.92) | 1(1.00) |
| Rash | 4(1.21) | 1(0.79) | 2(1.92) | 1(1.00) |
| Various musculoskeletal and con nective tissue diseases | 4(1.21) | 0(0.00) | 3(2.88) | 1(1.00) |
| Joint pain | 3(0.91) | 0(0.00) | 2( l.92) | l(l.00) |
| Myalgia | l(0.30) | 0(0.00) | 1(0.96) | 0(0.00) |
| Infection and infection of diseases | 3(0.91) | 1(0.79) | I (0.96) | l(l.00) |
| Pulmonary tuberculosis | 1(0.30) | 0(0.00) | 1(0.96) | 0(0.00) |
| Laryngitis | l (0.30) | 1(0.79) | 0(0.00) | 0(0.00) |
| Bronchitis | l (0.30) | 0(0.00) | 0(0.00) | 1(l.00) |
| Psychiatry | 2(0.61) | 1(0.79) | 1(0.96) | 0(0.00) |
| Sleep disorders | 1(0.30) | 0(0.00) | l(0.96) | 0(0.00) |
| Insom nia | l (0.30) | 1(0.79) | 0(0.00) | 0(0.00) |
| Kidney and urinary diseases | l(0.30) | 0(0.00) | 0(0.00) | 1(1.00) |
| Urination difficulties | 1(0.30) | 0(0.00) | 0(0.00) | 1(1.00) |
| Blood and lymphatic system diseases | l(0.30) | 0(0.00) | 1(0.96) | 0(0.00) |
| Lymph node disease | l(0.30) | 0(0.00) | I (0.96) | 0(0.00) |
Data are n (%). AEs=adverse events.
Table 4 : Incidences and list of Adverse Events (SS)
Figure 1: Distribution of subjects in the study
Tables at a glance
Figures at a glance