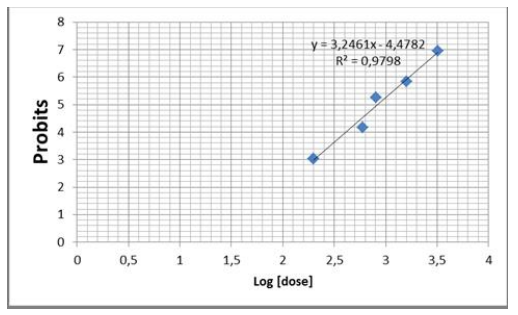
Figure 1: Plot of log dose of aqueous leaf extract of Cistus ladaniferus vs probit mortality values using probit analysis
Figure 1: Plot of log dose of aqueous leaf extract of Cistus ladaniferus vs probit mortality values using probit analysis
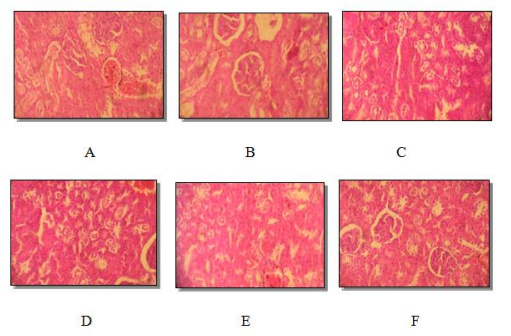
Figure 2: Histological section of male rat kidney (A) and female rat (B) control. Male rat (C) and female rat (D) treated (dose of 500mg / kg). Male rat (E) and female rat (F) treated (dose of 1500mg / kg). Vascular congestion. Hematoxylin Eosin Stain (Average magnification)
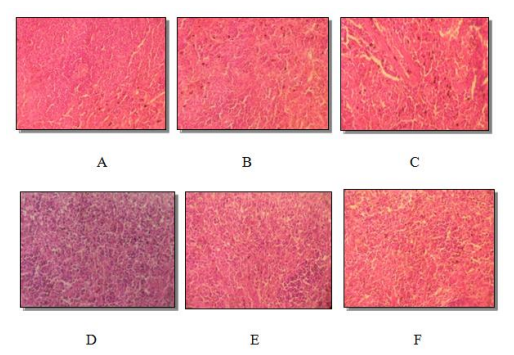
Figure 3: Histological section of male rat spleen (A) and female rat (B) controls. Male rat (C) and female rat (D) rats treated (500 mg / kg dose) treated male rat (E) and female rat (F) rats (dose of 1500 mg / kg). Eosin hematoxylin staining. (Average magnification)
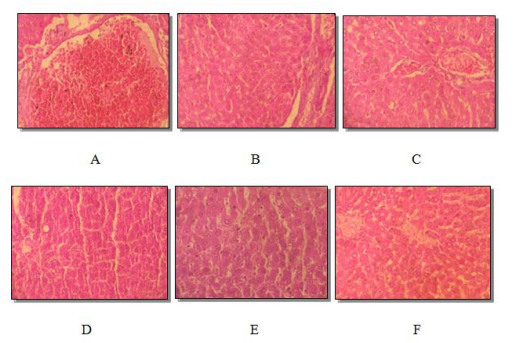
Figure 4: Histological section of male rat liver (A) and female rat (B) controls. Male rat (C) and female rat (D) treated (dose of 500mg / kg). Male rat (E) and female rat (F) treated (dose of 1500mg / kg). Eosin hematoxylin staining. (Average magnification)
Tables at a glance
Figures at a glance