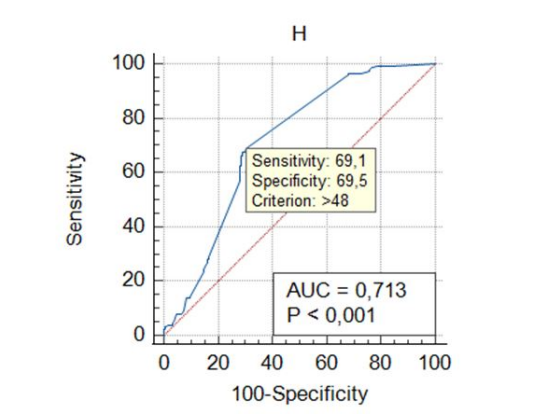
Figure 1: Receiver operating characteristic (ROC) curve analysis of delayed elimination in patients receiving HD-MTX
|
|
Whole population(N = 56 |
DEM+ (N = 179 samples, 26 courses) |
DEM- (N = 216 |
|
Age<18 y>18 y |
37 (66.1%)19 |
133 (74.3%)46 (25 .7%) |
153 (70.8%)63 |
|
Weight (kg) |
30 [10-90] |
30 [10-90] |
30 [10-90] |
|
Gender (M/F) |
34/22 (1.54) |
123/56 (2,19) |
123/93 (1.32) |
|
Cancer typeAcute lymphoblastic leukemia Non-hodgkin’s lymphomaLymphoblastic lymphoma BLymphoblastic lymphoma TCutaneous lymphomaOsteosarcoma |
31 (55.3%)21 |
109 (60.8%)52 (29%)10 |
107 (49.5%)77 |
|
MTX dose (g)/course |
5 [1.2-17] |
5 [1.2-17] |
5 [1.2-17] |
|
MTX time infusion 3-h infusion 24-h infusion |
230165 |
9188 |
13977 |
|
Renal impairement |
7 patients (30 C ) |
6 patients (24 C ) |
4 patients (6 C ) |
|
Number of courses |
2 [1-9] |
3 [1-9] |
2 [1-9] |
|
MTX concentration < toxic levelat 24hat 36hat 48hat 72h at 96hat 120h>120 h |
146/395 (36.9%)1/41 (0.02%)1/17 (0.5%)42/158 (2.6%)60/96 (6.2%)20/37 (5.4%)8/14 (5.7%)14/32 (4.3%) |
102/146(69.8%)00060/102 (58.8%)20 /102 (19.6%)8/102 (7.8%)14/102 (13.8%) |
44/146(30.2%)1/44 (2.3%1/44 (2.3%)42/44 (95.4%)---- |
|
Leucovorin rescue at 24 hat 36 hat 48 hat 72h at 96at 120 h>120 h |
841150107313 |
34000117313 |
5011490000 |
|
Associated |
2932561021735515 |
1011225171738 |
19213451101827 |
Table 1: Patient’s characteristics of whole population, patients with delayed (DEM+) and non-delayed (DEM-) elimination MTX
|
|
Univariate analysis |
MultivariateAnalysis |
|
|
Binary variable |
p- value |
Odds ratio(95% confidence interval) |
p- value |
|
Age (<18 y/ >18 y) |
0.79 |
- |
- |
|
Gender (M/F) |
0.016 |
2.11 [1.31- 3.39] |
0.002 |
|
MTX time infusion* |
0.0069 |
1.30 [0.84- 2.01] |
0.23 |
|
Renal impairement (Y/N) |
0.0003 |
5.97 [2.01- 17.72] |
0.001 |
|
Number of courses (1 or >1) |
0.005 |
0.83 [0.51- 1.33] |
0.44 |
|
Continuous variable |
p- value |
Β-coefficient (95% confidence interval) |
p- value |
|
MTX dose/course |
0.0002 |
0.91 [0.83- 0.99] |
0.03 |
|
Weight |
0.001 |
0.99 [0.98- 1.00] |
0.47 |
Table 2: Risk factors associated with delayed elimination MTX
For whole population, characteristics (age, gender, indications) were presented according to patients and they were presented according to MTX sampling, elsewhere.
Figure 1: Receiver operating characteristic (ROC) curve analysis of delayed elimination in patients receiving HD-MTX
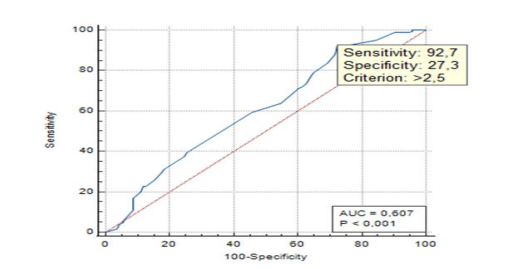
Figure 2: ROC curve analysis of MTX doses associated with delayed elimination
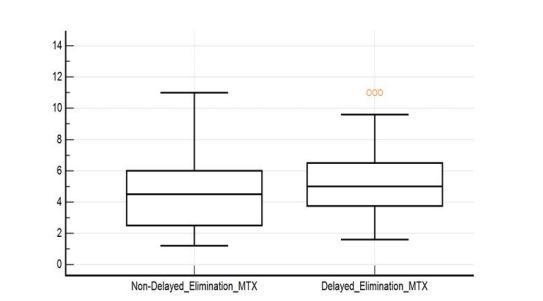
Figure 3: Comparaison of doses between patients with delayed and non- delayed elimination MTX
Tables at a glance
Figures at a glance